Abstract
In the beginning of 2015 it was reported that there may be something wrong with the photometric measurements of Tangra 3.2.3. A thorough examination of the measuring code revealed a problem where the background annulus wasn't been positioned correctly in the majority of the cases which makes the "Average Background" readings incorrect. While this has little to no effect on the timing of asteroidal occultations it may have significant effect on any quantitative measurements i.e. where stellar magnitudes are derived or where relative flux is measured such as in the case of Mutual Satellite events (PHEMU events). The problem also had effect in the case where Aperture Photometry was used with 3D Poly background. There was no effect on the other signal or background measurement modes and combinations.
After the problem was fixed in Tangra 3.3 I decided to do a comprehensive study of the quantitative photometric measurements of Tangra 3 and to present the results of the tests in this article. The following tests were performed:
Method
For this purpose I generated a modelled video with 5 stars with modelled constant brightness with the following characteristics:
| Parameter |
Noise |
Flickering |
FWHM |
Gamma |
Star1 Mag |
Star1 Intensity |
Star2 Mag |
Star3 Mag |
Star4 Mag |
Star5 Mag |
| Value |
Mean: 14.5 StdDev: 4 |
StdDev: 0 |
3.5 |
1.0 |
12.00 |
185 |
10.00 |
11.50 |
13.50 |
14.10 |
The generated video can be downloaded from
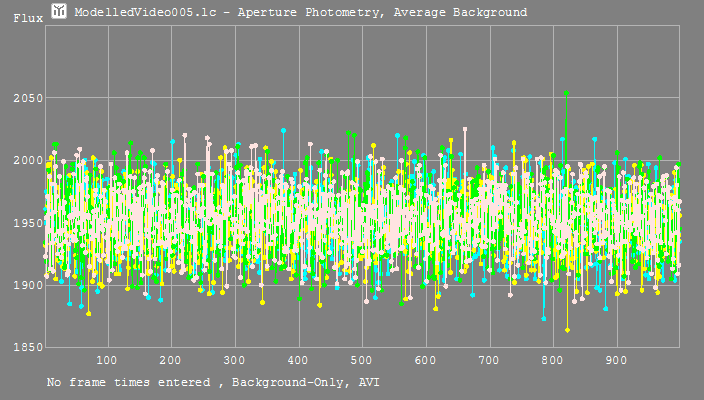
ModelledVideo005.avi (234 Mb) and the reduced light curve
ModelledVideo005.lc (4 Mb) is also available. I then ran sets of reductions of the .lc fie with different parameters using the
Data -> Quick Re-Process menu command in Tangra 3. Next are presented the test I performed and their results.
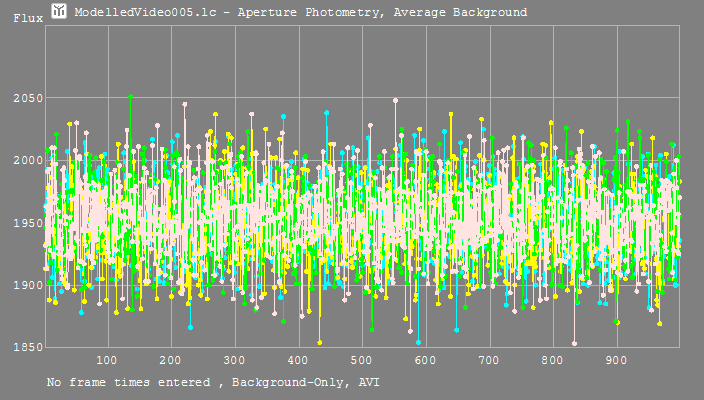
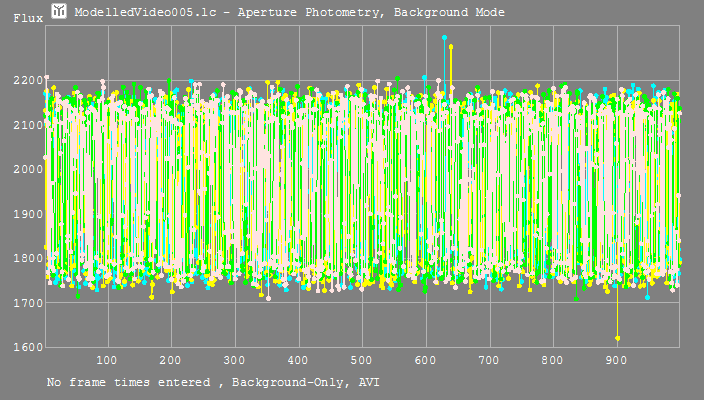
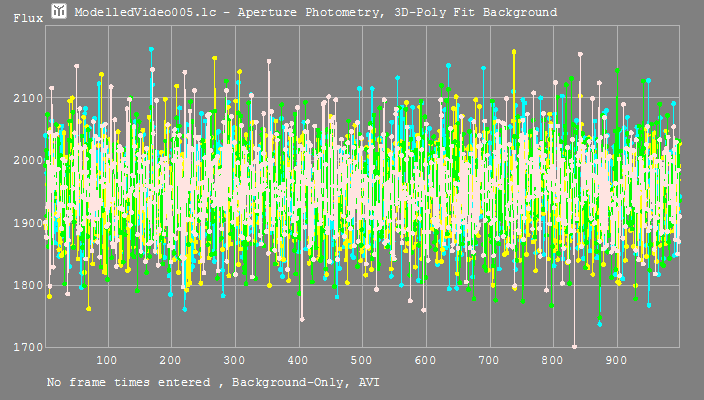
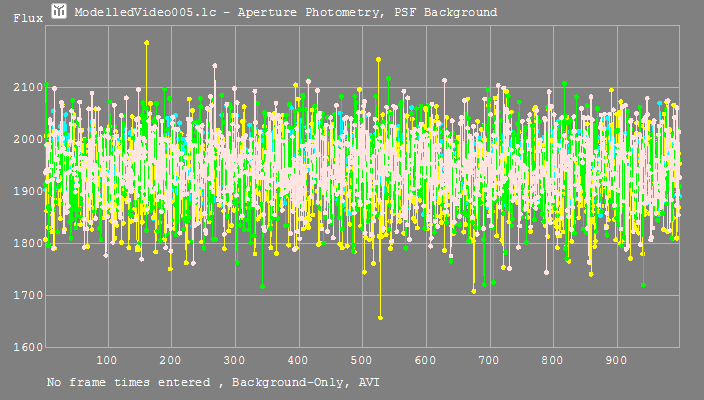
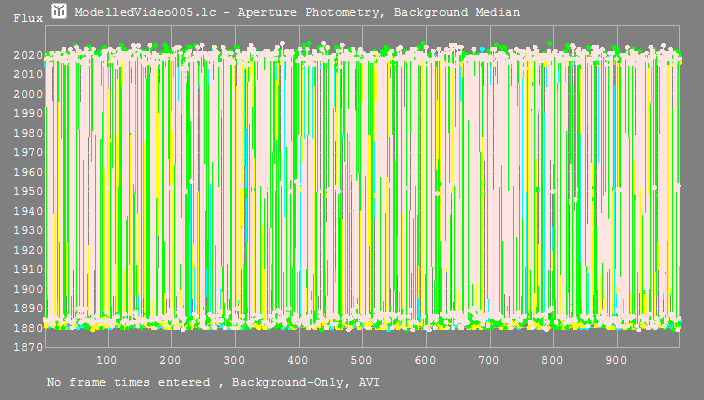
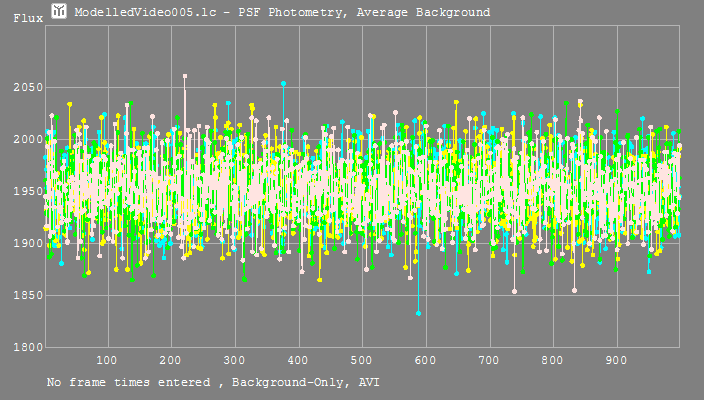
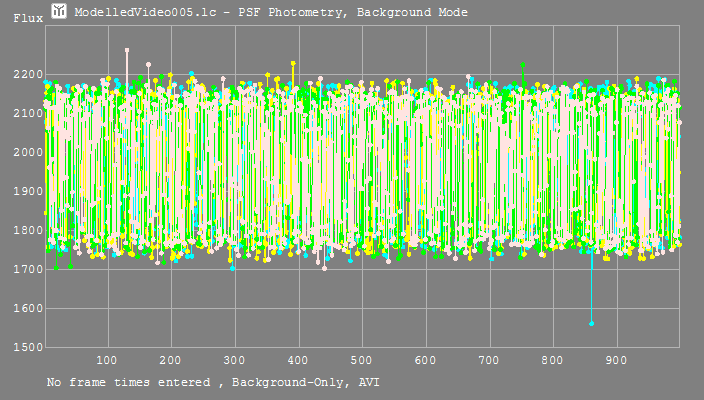
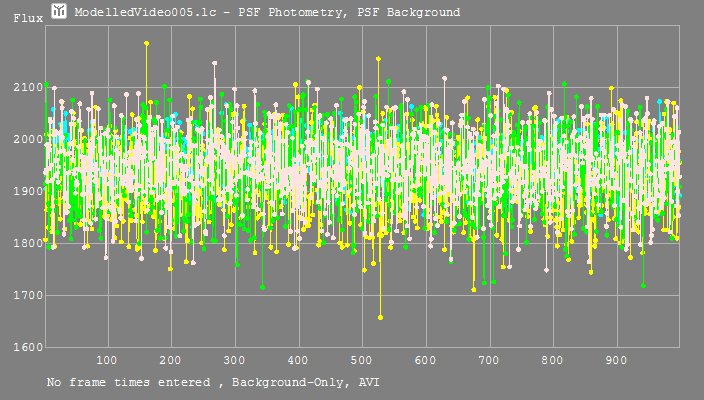
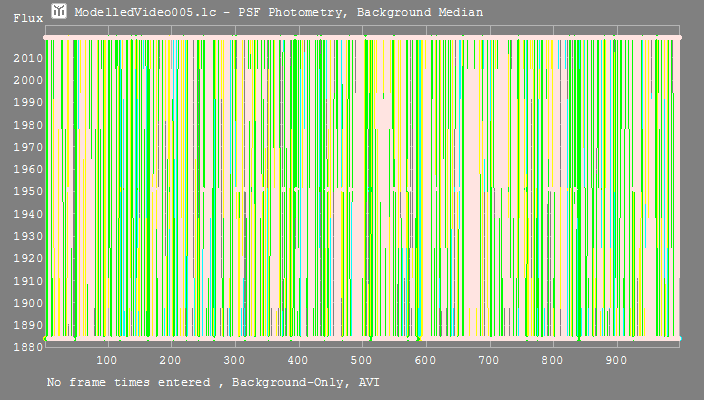
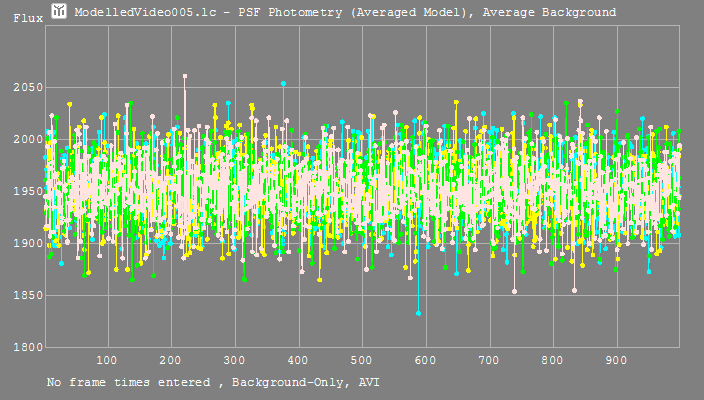
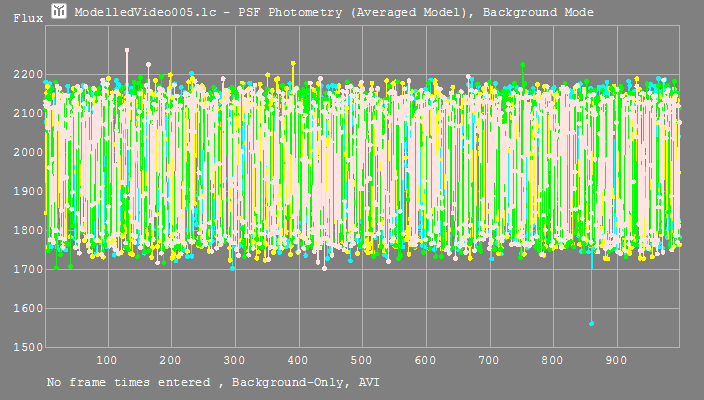
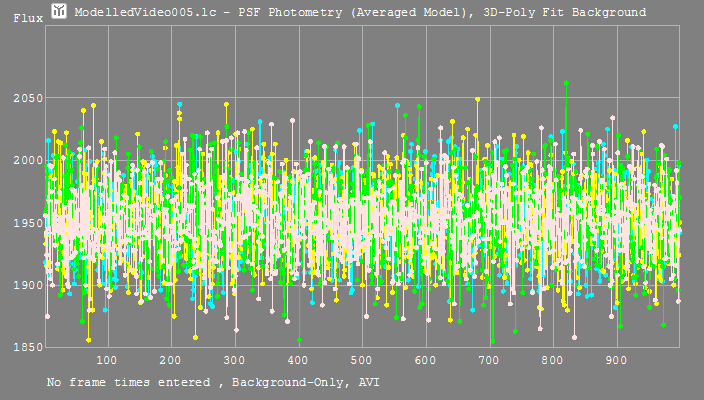
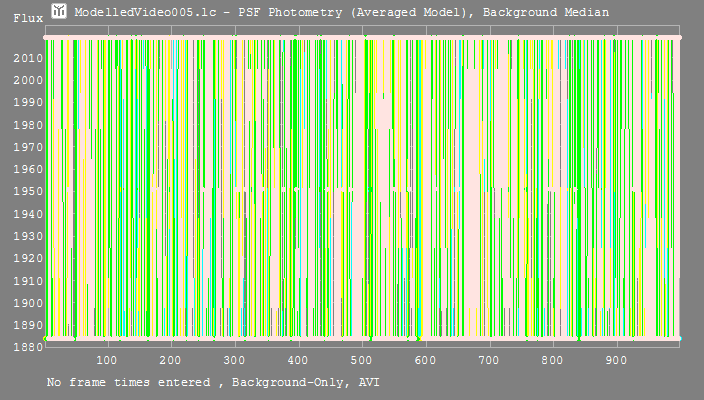
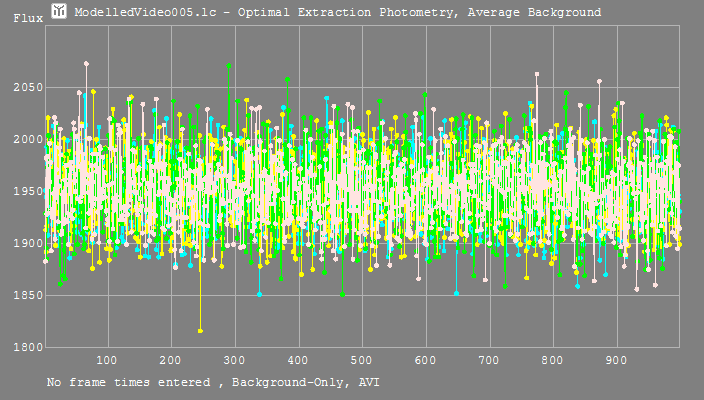
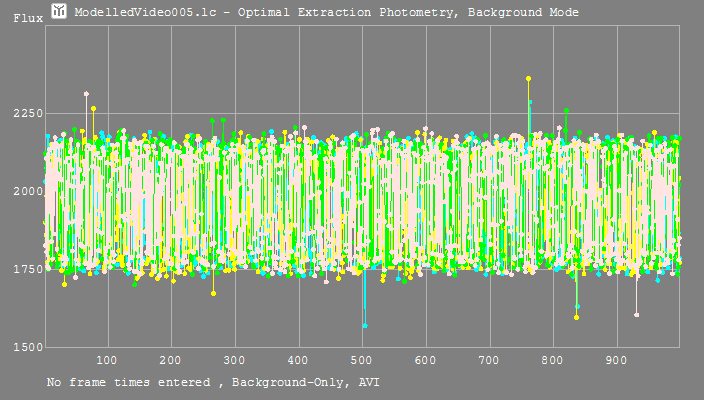
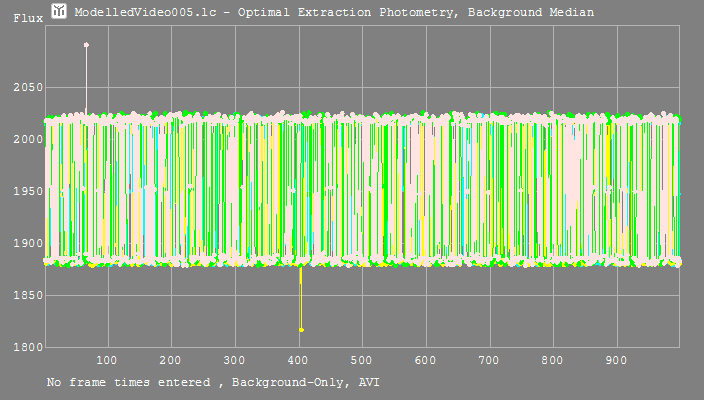
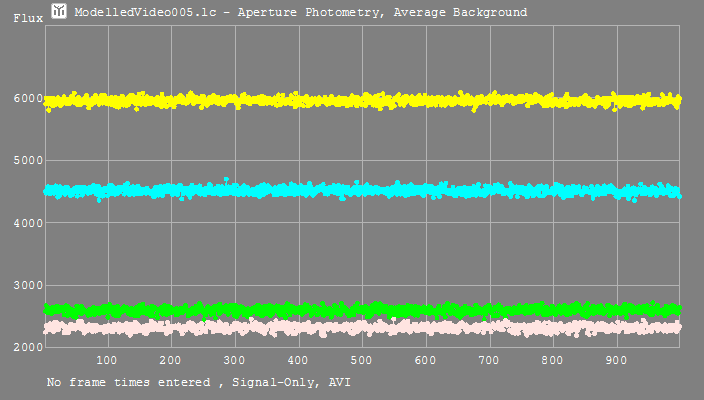
Same Background Readings When Using the Same Background Method
In this test all targets had the same aperture of 6.55 pixels. Reduction was done with all possible combinations of signal and background reduction method. The Background-Only light curves were checked and it was verified that the readings of the background for all stars was at the same or very similar level. Below are given the light curves from the Background-Only measurements and the average background reading with the 3-sigma error from the variation considering that the circular aperture has an area of πr
2, where r is the aperture in pixels (6.55 in all tests below). Click on the images for a full-size version.
| \ |
Average Background |
Background Mode |
3D Polynomial Fit |
PSF-Fitting Background |
Median Background |
| Aperture Photometry |
| 14.48 |
14.46 |
14.49 |
14.49 |
| ±0.62 |
±0.65 |
±0.62 |
±0.64 |
|
| 14.69 |
14.65 |
14.74 |
14.73 |
| ±3.50 |
±3.53 |
±3.52 |
±3.57 |
|
| 14.49 |
14.44 |
14.49 |
14.51 |
| ±1.46 |
±1.41 |
±1.46 |
±1.44 |
|
| 14.47 |
14.27 |
14.40 |
14.45 |
| ±0.92 |
±1.51 |
±1.49 |
±1.47 |
|
| 14.54 |
14.52 |
14.56 |
14.56 |
| ±1.47 |
±1.47 |
±1.46 |
±1.46 |
|
PSF Photometry
(Direct Non-Linear Fit) |
| 14.49 |
14.48 |
14.49 |
14.49 |
| ±0.63 |
±0.65 |
±0.64 |
±0.65 |
|
| 14.76 |
14.67 |
14.73 |
14.71 |
| ±3.43 |
±3.48 |
±3.51 |
±3.49 |
|

| 14.48 |
14.48 |
14.51 |
14.50 |
| ±0.62 |
±0.68 |
±0.82 |
±0.76 |
|
| 14.48 |
14.28 |
14.39 |
14.44 |
| ±0.91 |
±1.51 |
±1.49 |
±1.47 |
|
| 14.57 |
14.53 |
14.56 |
14.54 |
| ±1.45 |
±1.48 |
±1.46 |
±1.47 |
|
PSF Photometry
(Linear Fit of Averaged Model) |
| 14.49 |
14.48 |
14.49 |
14.49 |
| ±0.63 |
±0.65 |
±0.64 |
±0.65 |
|
| 14.76 |
14.67 |
14.73 |
14.71 |
| ±3.43 |
±3.48 |
±3.51 |
±3.49 |
|
| 14.48 |
14.48 |
14.49 |
14.48 |
| ±0.61 |
±0.66 |
±0.67 |
±0.65 |
|
| 14.74 |
15.70 |
14.58 |
14.53 |
| ±0.85 |
±1.27 |
±1.23 |
±1.23 |
|
| 14.57 |
14.53 |
14.56 |
14.54 |
| ±1.45 |
±1.48 |
±1.46 |
±1.47 |
|
| Optimal Extraction Photometry |
| 14.48 |
14.46 |
14.50 |
14.48 |
| ±0.65 |
±0.72 |
±0.75 |
±0.72 |
|
| 14.70 |
14.63 |
14.75 |
14.63 |
| ±3.48 |
±3.40 |
±3.30 |
±3.40 |
|

| 14.48 |
14.48 |
14.51 |
14.50 |
| ±0.62 |
±0.68 |
±0.82 |
±0.76 |
|

| 14.47 |
14.27 |
14.40 |
14.45 |
| ±0.92 |
±1.51 |
±1.49 |
±1.47 |
|
| 14.56 |
14.51 |
14.57 |
14.54 |
| ±1.46 |
±1.48 |
±1.46 |
±1.47 |
|
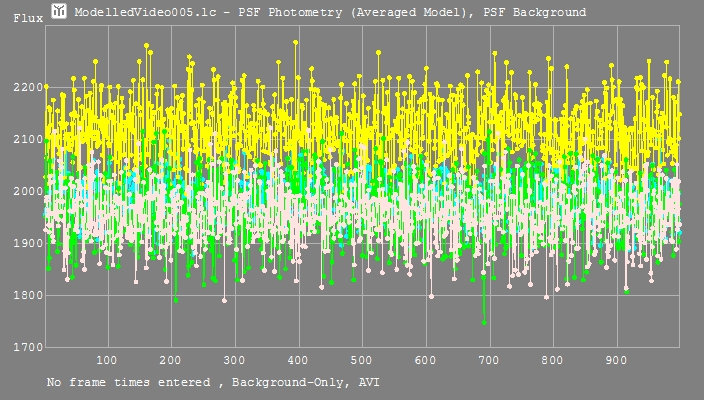
Discussion: All background measurements for all objects were at the same level when using the same settings (with the exception of PSF Fitting Background when Liner Fit of Averaged Model is used - see bellow for more info). Тhe two methods that use a median calculation (Background Mode and Median Background) are retuning quantum type values because a median is always a whole number and 8 bit video only has 256 unique values. Thus the median values for a background will be always one of a few close fixed numbers in each frame resulting only in a small number of distinct "quantum" background values for each object in all frames.
An interesting result was revealed by the PSF Fitting Background method when used with an Liner Fit of Averaged Model. In this case all four measured stars showed slightly different values for the background which can be contributed to the different fitting method being used. This result also shows that the Liner Fit of Averaged Model is a less accurate method for determining the background noise when compared to the non-linear least square fitting.
Please also note that the originally modelled video shows that the noise median is 15.0. However because of a problem with truncating (rather than rounding) the floating point noise values to 8-bit integers, the effective noise median was actually 14.5. Most of the background methods derived a value which is very close to this too. The truncation has been now replaced with rounding and the noise generation uses exactly the value given by the user.
The conclusion is that (1) caution should be taken when using Background Mode and Median Background with 8 bit videos and (2) the Liner Fit of Averaged Model PSF fitting method is less accurate when comes to determining the background level.
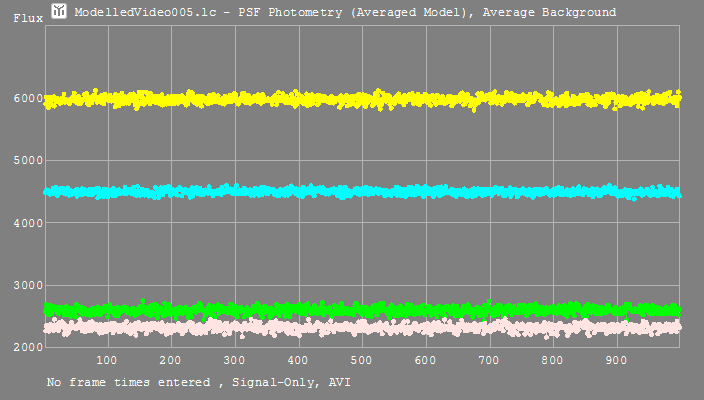
For completeness next is presented the Signal-Only measurement for each of the 4 photometric methods used. All methods show very similar readings.
| Aperture Photometry |
PSF Photometry
(Direct Non-Linear Fit) |
PSF Photometry
(Linear Fit of Averaged Model) |
Optimal Extraction Photometry |
 |
 |
 |
 |
Correct Magnitude Derived from Photometric Measurements
The next test is to determine the stellar magnitudes of the objects from the measurements with the various photometric methods used for signal and background readings. Here for each of the objects we determine the average Signal-Minus-Background reading (with the error bars) and from this we compute a stellar magnitude. We determine the zero point by assigning a magnitude of 12.00 for the first blue object (which was the modelled magnitude for it) and then deriving the magnitudes for the remaining 3 objects based on this zero point. The results are presented in the table below:
| \ |
Average Background |
Background Mode |
3D Polynomial Fit |
PSF-Fitting Background |
Median Background |
Total Score for Signal Methods |
| Aperture Photometry |
| 11.51 |
13.50 |
14.12 |
| ±0.01 |
±0.09 |
±0.15 |
|
| 11.51 |
13.59 |
14.35 |
| ±0.05 |
±0.30 |
±0.59 |
|
| 11.51 |
13.51 |
14.14 |
| ±0.02 |
±0.14 |
±0.23 |
|
| 11.51 |
13.48 |
14.11 |
| ±0.02 |
±0.09 |
±0.17 |
|
| 11.51 |
13.51 |
14.16 |
| ±0.02 |
±0.14 |
±0.25 |
|
56 (21) |
| PSF Photometry(Direct Non-Linear Fit) |
| 11.51 |
13.51 |
14.13 |
| ±0.02 |
±0.10 |
±0.17 |
|
| 11.50 |
13.58 |
14.34 |
| ±0.04 |
±0.30 |
±0.58 |
|
| 11.51 |
13.51 |
14.14 |
| ±0.02 |
±0.11 |
±0.18 |
|
| 11.50 |
13.48 |
14.11 |
| ±0.01 |
±0.07 |
±0.13 |
|
| 11.50 |
13.52 |
14.16 |
| ±0.02 |
±0.14 |
±0.25 |
|
48 (23) |
| PSF Photometry(Linear Fit of Averaged Model) |
| 11.50 |
13.49 |
14.11 |
| ±0.02 |
±0.10 |
±0.17 |
|
| 11.49 |
13.57 |
14.33 |
| ±0.04 |
±0.30 |
±3.58 |
|
| 11.50 |
13.49 |
14.11 |
| ±0.02 |
±0.10 |
±0.16 |
|
| 11.53 |
13.50 |
14.11 |
| ±0.01 |
±0.04 |
±0.07 |
|
| 11.50 |
13.51 |
14.15 |
| ±0.02 |
±0.14 |
±0.25 |
|
45 (14) |
| PSF Photometry(Full Analytical Quadrature) |
N/A |
N/A |
| 11.50 |
13.48 |
14.11 |
| ±0.01 |
±0.07 |
±0.13 |
|
| 11.50 |
13.48 |
14.11 |
| ±0.01 |
±0.07 |
±0.13 |
|
N/A |
- (-) |
| Optimal Extraction Photometry |
| 11.51 |
13.51 |
14.12 |
| ±0.02 |
±0.10 |
±0.16 |
|
| 11.50 |
13.58 |
14.28 |
| ±0.04 |
±0.28 |
±0.53 |
|
| 11.51 |
13.51 |
14.12 |
| ±0.01 |
±0.10 |
±0.16 |
|
| 11.50 |
13.48 |
14.10 |
| ±0.01 |
±0.08 |
±0.14 |
|
| 11.50 |
13.52 |
14.15 |
| ±0.02 |
±0.14 |
±0.24 |
|
43 (17) |
| Total Score for Background Methods |
14 |
100 |
18 |
13 |
39 |
Discussion: It is evident that under the moderate noise conditions all combinations of photometric methods for signal and background produced accurate results. The faintest star was, as expected, the most difficult target to measure with the biggest differences of around 0.2 magnitudes for all stars. This was produced with the 'Background Mode' background method. The most accurate measurements of the faintest star were done with the "PSF-Fitting Background" background method.
It is difficult to say which was the best signal and background methods as their results were pretty close. However the PSF-Fitting Background is just with 1 point better than the Average Background, which is with 4 point ahead of the 3D Polynomial Fit. The median based Background Mode and Median Background were the worst methods for 8 bit video. For signal and if we exclude the Background Mode score from the result, the best method was the Liner Fir of Averaged Model PSF Photometry followed by Optimal Extraction Photometry.
It is interesting to note that even though the PSF-Fitting Background with the Linear Fit of Averaged Model PSF Photometry was least consistent, the derived magnitudes were a lot better than the magnitudes derived from the median-based background methods. Over all the most accurate combinations where for Linear Fit of Averaged Model PSF Photometry with both Average Background and 3D Polynomial Fit. These combinations however have so little advantage that it will be wrong to say that the other combinations (excluding the median-based backgrounds) were worse. Still this result is consistent with the findings of the DAPHOT photometric software package that the most accurate results for stellar magnitudes are achieved with PSF photometry where the background is not derived from the PSF fit but rather using other methods
(Stetson. P., [1]).
Over all the results were very good and on target.
Reasonable Aperture Sizes Have Little to No Effect
In this test I wanted to check the effect of the aperture sizes on the accuracy of the measurements. This test was only done with Aperture Photometry with Average Background (shown as Aperture Photometry below) and Direct Non-Linear PSF Photometry with PSF-Fitting Background (shown as PSF Photometry below). Various aperture sizes were used and for each case stellar magnitudes were calculated. The results are presented below:
| \ |
2.00 (0.6 FHWM) |
2.80 (0.8 FHWM) |
3.90 (1.1 FHWM) |
5.20 (1.5 FHWM) |
6.55 (1.9 FHWM) |
8.90 (2.5 FHWM) |
Mixed (1.9; 0.7; 1.3; 2.6) |
| Aperture Photometry |
| 11.53 |
13.49 |
14.11 |
| ±0.01 |
±0.04 |
±0.07 |
|
| 11.52 |
13.50 |
14.10 |
| ±0.01 |
±0.04 |
±0.08 |
|
| 11.52 |
13.49 |
14.11 |
| ±0.01 |
±0.05 |
±0.09 |
|
| 11.51 |
13.50 |
14.12 |
| ±0.01 |
±0.07 |
±0.12 |
|
| 11.51 |
13.50 |
14.12 |
| ±0.01 |
±0.09 |
±0.15 |
|
| 11.52 |
13.52 |
14.15 |
| ±0.02 |
±0.16 |
±0.28 |
|
| 12.07 |
13.55 |
14.14 |
| ±0.01 |
±0.06 |
±0.29 |
|
| PSF Photometry |
| 11.50 |
13.49 |
14.10 |
| ±0.01 |
±0.04 |
±0.07 |
|
| 11.50 |
13.48 |
14.11 |
| ±0.01 |
±0.07 |
±0.13 |
|
| 11.50 |
13.48 |
14.11 |
| ±0.01 |
±0.07 |
±0.13 |
|
| 11.50 |
13.48 |
14.11 |
| ±0.01 |
±0.07 |
±0.13 |
|
| 11.50 |
13.48 |
14.11 |
| ±0.01 |
±0.07 |
±0.13 |
|
| 11.50 |
13.49 |
14.10 |
| ±0.01 |
±0.04 |
±0.07 |
|
| 13.59 |
14.30 |
13.41 |
| ±0.01 |
±0.07 |
±0.13 |
|
Discussion: It is evident that the photometric measurements are accurate to within 0.02 - 0.05 mags regardless of the aperture size as long as the aperture size is the same for all objects. This seems to be true for aperture sizes as small as 0.5 FWHM and as large as 2.5 FWHM. It is also interesting that the PSF Photometry is more accurate in all cases, including with very small and very large apertures, and its correctness doesn't depend on the aperture size. Aperture Photometry shows bigger errors with both very small and very large apertures.
The Effect of Aperture Size in 16 bit CCD Photometry
In the previous test we looked into the effects of the aperture size when doing photometry from 8 bit simulated video. The expected accuracy in stellar magnitudes corresponding to the typical SNR of video is probably around 0.02 mags. For bright stars this could go down to 0.01 mags but for faint ones may be more of a 0.05 - 0.10 magnitudes. These are quite large differences when compared to typical accuracy of photometry from calibrated CCD images. The next test was not done in Tangra but was done in MaximDL by Margaret Streamer using some of her variable star CCD images -
DZ-Vel-Images.zip (18Mb). The purpose was to examine the effect of the aperture size on precise photometric measurements from 16 bit CCD images and compare them to those achieved in video. Those same CCD images were later used in Tangra to validate the dark and flat frame corrections applied by Tangra.
All measured images were dark, bias and flat field corrected in MaximDL. The table below gives the determined magnitudes of the check star and variable star when measurements were done with different aperture sizes. The background annulus was always positioned at the same place to exclude differences due to background calculations. The comparison star has a magnitude of 9.953 and the check star has a magnitude of 11.890.
| Check Star (Same Annulus Positions) |
| Frame No\Aperture |
(1.5 FWHM) 6:24:12 |
(2.0 FWHM) 8:20:12 |
(2.5 FWHM) 10:18:12 |
(3.0 FWHM) 12:16:12 |
(3.5 FWHM) 14:14:12 |
(4.0 FWHM) 16:12:12 |
Variation |
| 143 |
11.904 |
11.903 |
11.904 |
11.905 |
11.904 |
11.903 |
0.002 |
| 153 |
11.905 |
11.906 |
11.908 |
11.910 |
11.911 |
11.910 |
0.006 |
| 175 |
11.908 |
11.907 |
11.907 |
11.907 |
11.906 |
11.905 |
0.003 |
| 189 |
11.900 |
11.898 |
11.898 |
11.898 |
11.897 |
11.896 |
0.004 |
| 222 |
11.902 |
11.899 |
11.898 |
11.899 |
11.898 |
11.897 |
0.005 |
| Aperture |
 |
 |
 |
 |
 |
 |
|
|
| Variable Star (Same Annulus Positions) |
| Frame No\Aperture |
(1.5 FWHM) 6:24:12 |
(2.0 FWHM) 8:20:12 |
(2.5 FWHM) 10:18:12 |
(3.0 FWHM) 12:16:12 |
(3.5 FWHM) 14:14:12 |
(4.0 FWHM) 16:12:12 |
Variation |
| 143 |
11.989 |
11.983 |
11.977 |
11.965 |
11.953 |
11.949 |
0.051 |
| 153 |
11.964 |
11.959 |
11.953 |
11.940 |
11.928 |
11.926 |
0.033 |
| 175 |
11.906 |
11.904 |
11.899 |
11.888 |
11.876 |
11.872 |
0.034 |
| 189 |
11.859 |
11.856 |
11.851 |
11.841 |
11.830 |
11.826 |
0.033 |
| 222 |
11.760 |
11.756 |
11.751 |
11.743 |
11.735 |
11.733 |
0.027 |
| Aperture |
 |
 |
 |
 |
 |
 |
|
|
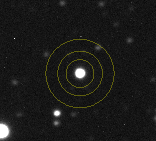
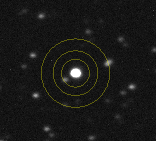
Discussion: There is a large difference between the variations of the check star and the variable star: 0.004 vs 0.035. Looking at the positioning of the aperture it is evident that the difference is due to the faint star at the bottom left of the variable star being included in the measuring aperture as the aperture increases. For the check stars variations are very minimal with the variations in frame 153 going the other way - producing fainter magnitude as the aperture increases. The AAVSO recommended aperture size for variable star photometry is 3 to 4 FWHM.
Looking only at the check star measurements the bigger the aperture the brighter the star appeared. This indicates that the bigger the aperture the more light from the star is included in the aperture.
The Effect of Aperture Size in Modelled and Real Star Field Videos
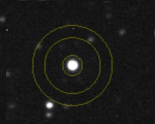
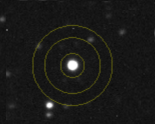
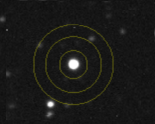
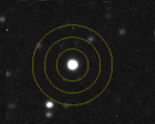
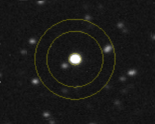
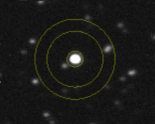
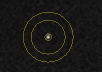
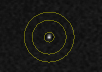
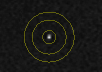
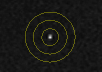
In this test I measured two videos. The first one was the modelled video we have been using so far and the measured stars was the standard (12.00 mag) and the second faintest star (13.50 mag). The second video is of M41 taken with r' SLOAN filter. Two stars were measured on the same frame with different apertures but same annulus size and positions, the stars were: Comparison 4U 347-016538, r'= 12.141
and Check 4U 347-016475, r'= 11.995.
Measurements are presented below. The aperture sizes are given in FWHM, in pixels (aperture:gap:annulus) and in Tangra's terms (aperture in pixels|inner annulus radius in signal apertures|number of pixels in annulus). The positions of the aperture and annulus are also presented graphically.
| Check Star (Same Annulus Positions) |
| Measurement\Aperture |
1.0 FWHM
3.3:11.7:17.3
3.3|4.55|1000 |
1.5 FWHM
5.0:10:17.3
5.0|3.00|1000 |
2.0 FWHM
6.6:8.4:17.3
6.6|2.27|1000 |
2.5 FWHM
8.5:6.5:17.3
8.5|1.76|1000 |
3.0 FWHM
9.9:5.1:17.3
9.9|1.52|1000 |
3.5 FWHM
11.6:3.4:17.3
11.6|1.29|1000 |
4.0 FWHM
13.2:1.8:17.3
13.2|1.14|1000 |
Variation(4.0 FWHM - 1.0 FWHM) |
| Modelled |
 |
 |
 |
 |
 |
 |
 |
|
| Aperture/Average BG |
13.50 |
13.51 |
13.50 |
13.52 |
13.52 |
13.57 |
13.57 |
0.07 |
| PSF/PSF BG |
13.45 |
13.45 |
13.45 |
13.45 |
13.45 |
13.45 |
13.45 |
0.00 |
| M41 |
 |
 |
 |
 |
 |
 |
 |
|
| Aperture/Average BG |
11.96 |
11.96 |
11.91 |
11.90 |
11.97 |
11.99 |
12.00 |
0.10 |
| Aperture/Median BG |
11.97 |
11.97 |
11.95 |
12.03 |
12.05 |
12.06 |
12.06 |
0.09 |
Discussion: When PSF Photometry with PSF Background is used the aperture size won't matter and the different apertures will always give the same stellar magnitude. In fact the measurement in magnitudes only depends on the fitted PSF and not on the used aperture. The results for the real world scenario with M41 are similar to those with the modelled video. The variations in both of them is less than 0.1 magnitudes. While this is a large variation, compared to the ~0.005 mags for 16 bit CCD photometry, it is comparable to the expected accuracy of video photometry of around 0.05 - 0.10 magnitudes.
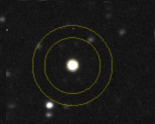
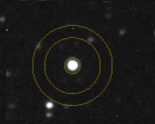
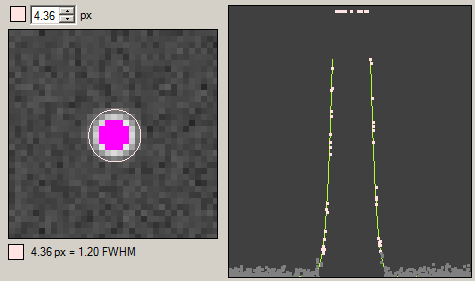
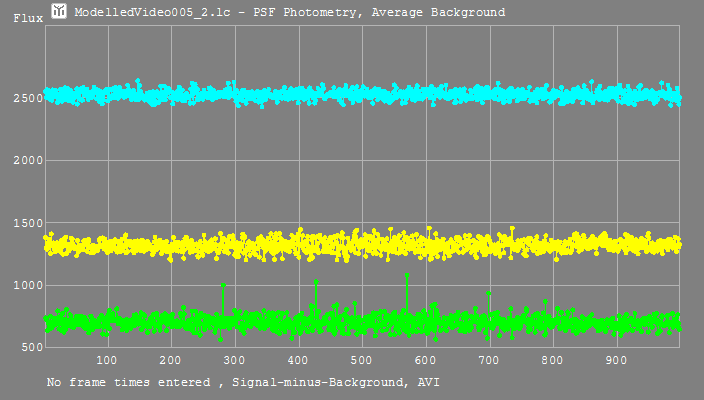
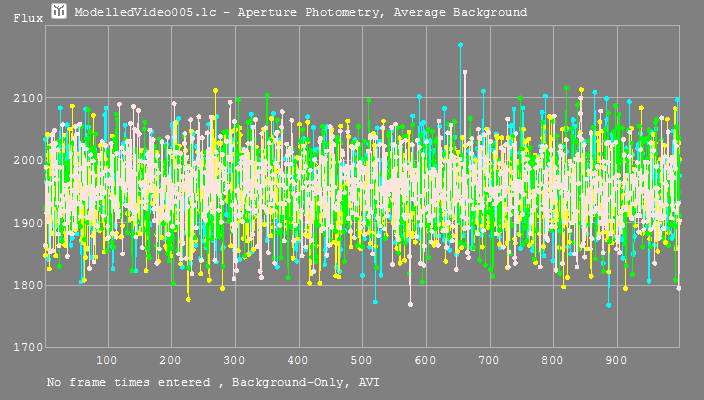
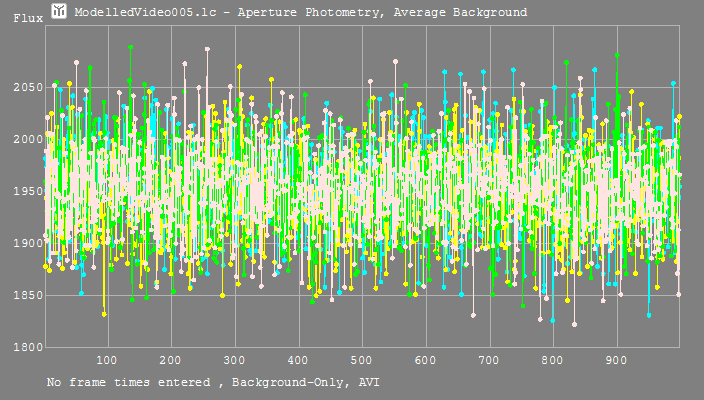
Measuring Saturated Objects
In this test I wanted to check the effect of saturated stars on stellar magnitude measurements. For this I did another measurement of the base model video
ModelledVideo005.avi but this time measuring the saturated star of magnitude 10.0 and also the two stars of the close pass-by simulation. The light curve of this measurement is available in
ModelledVideo005_2.lc (4 Mb). For this test I determined the stellar magnitude of the saturated star when using both Aperture Photometry and PSF Photometry and the results are presented below.
|
Aperture Photometry |
|
| PSF Photometry |
|
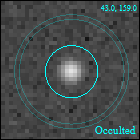
As it was expected the Aperture Photometry was off by a lot (0.7 magnitudes) while the PSF Photometry was off by only 0.07 magnitudes. This test confirms that PSF Photometry can be used successfully in quantitative photometric measurements even when moderately saturated stars are involved. As displayed on the PSF fit and the aperture, 21 out of around 50 pixels in the aperture were saturated but the measurement was still quite good.
Using Overlapping PSF Fitting
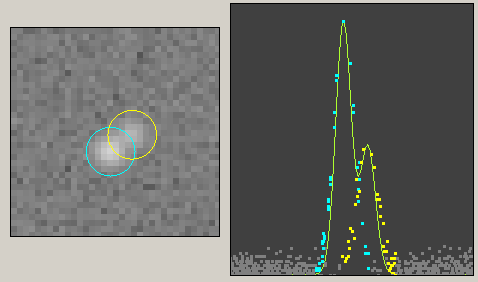
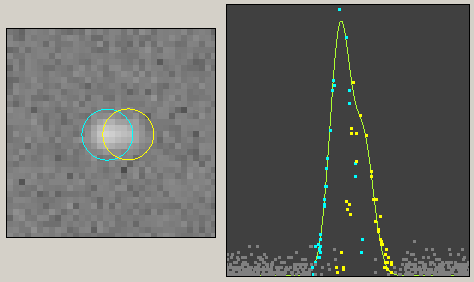
One of the new features in Tangra3 is the ability to fit a model that consists of 2 very close stars on a non-constant background. The main reason to implement this functionality was to allow the measurement of Jovian satellites which appear very close to each other and also close to Jupiter - in its glow. While during the implementation I tested
this functionality with modelled videos I haven't presented the results before so thought that this article will be a good place to do this.
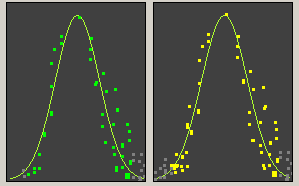
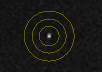
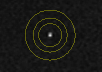
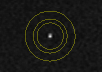
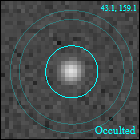
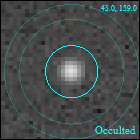
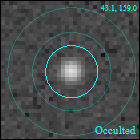
The first test represents simply the measurements of the two modelled stars passing by at a distance of 1 FWHM between their centres (3.5 pixels). In order to measure the stars individually a PSF Photometry must be used. The first two images below show the distance between the stars at the beginning and at the moment of closest approach. The third one show the separated PSF fits at the time of the closest approach.
Looking at the light curve we see consistent readings for both close passing-by stars during the whole simulation.
The derived magnitudes for the two stars are as follows:
| Modelled |
Measured |
| 12.65 |
13.27 |
12.71 |
13.39 |
| |
|
±0.04 |
±0.11 |
This shows a pretty good consistency with the modelled values and shows that Tangra can be used to measure accurately objects that come very close to each other.
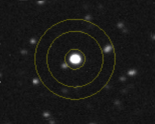
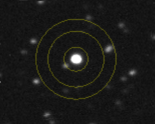
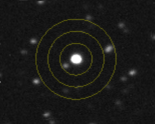
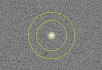
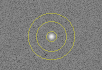
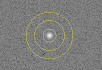
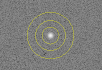
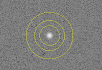
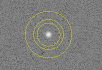
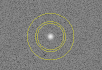
The Effect of the Background Annulus Size
In this test I wanted to check the effect of the size of the background aperture into the measurements. The default value in Tangra is 350 pixels. I used Aperture Photometry with Average Background to measure the background noise and the magnitudes of three of the stars and compared them. The measurements were done when the background was 100, 200, 350 and 500 pixels. The 500 pixels background annulus was put 0.5 FWHM away from the signal aperture, in all other cases the distance was the default 1.0 FWHM (2.0 FWHM from the centre).
| 100 Pixels |
 |
| BG: 14.49 |
11.51 |
13.51 |
14.13 |
| ±1.20 |
±0.02 |
±0.12 |
±0.20 |
 |
|
| 200 Pixels |
 |
| BG: 14.49 |
11.51 |
13.50 |
14.12 |
| ±0.86 |
±0.02 |
±0.10 |
±0.17 |
 |
|
| 350 Pixels |
 |
| BG: 14.48 |
11.51 |
13.50 |
14.12 |
| ±0.63 |
±0.01 |
±0.09 |
±0.15 |
 |
|
| 500 Pixels |
 |
| BG: 14.48 |
11.51 |
13.50 |
14.12 |
| ±0.53 |
±0.01 |
±0.09 |
±0.14 |
 |
|
Discussion: Clearly and logically the error bars for the background are getting smaller when the number of pixels used to determine the background value is increasing. At the same time there is no big difference between the determined background values and stellar magnitudes for the stars. The error bars for the stellar magnitude are also getting smaller when the number of pixels increase but there is almost no difference between the error bars for the 350 pixel annulus and the 500 pixel one. However while the background error bars have decreased by 100% when comparing the 100 pixel and 350 pixel values, they have only decreased by 19% when comparing the 350 pixel value with the 500 pixel values.
The conclusion is that the default background annulus value of 350 pixels gives very adequate results and the improvement from the 500 pixels annulus would be very minimal.
Dark, Flat and Bias Frames are Applied Correctly
In this test I used CCD images of a variable star provided by Margaret Streamer to compare the stellar magnitudes determined by Tangra to those Margaret determined using MaximDL. The purpose was to verify that the calibration frames are applied correctly by Tangra. We used 5 images of DZ Vel which are available here:
DZ-Vel-Images.zip (18Mb). The calibration frames applied were a Master Bias, a Master Dark (longer exposure) and a Master Flat. Tangra automatically reads the exposure from the FITS header and adjusts the Master Dark to the same exposure as the science frame. A finder chart with the comparison star (C), check star (K) and the Variable Star (DZ Vel) is shown below.
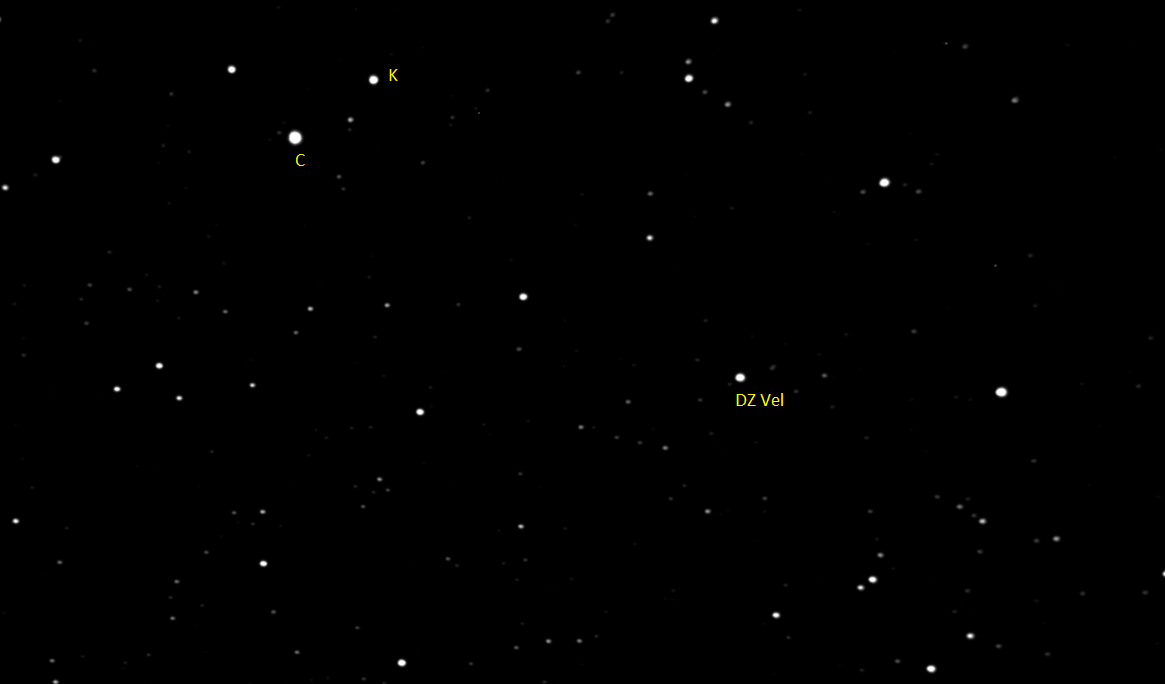
The comparison star has a magnitude of 9.953 and the check star has a magnitude of 11.890. The position of the annulus and the size of the measuring apertures turned out to have a considerable effect on the results. We both ended up using the following settings: aperture of 14 pixels, gap of 8 pixels and annulus of 12 pixels (in Tangra aperture of 14 pixels and annulus with inner radius of 1.6 apertures and containing 2111 pixels). Here are the results:
| Check Star |
| Frame No |
143 |
153 |
175 |
189 |
222 |
| Tangra |
11.907 |
11.907 |
11.908 |
11.900 |
11.901 |
| MaximDL |
11.905 |
11.910 |
11.907 |
11.898 |
11.899 |
| Difference |
0.002 |
0.003 |
0.001 |
0.002 |
0.002 |
 |
|
| Variable Star |
| Frame No |
143 |
153 |
175 |
189 |
222 |
| Tangra |
11.972 |
11.948 |
11.895 |
11.845 |
11.748 |
| MaximDL |
11.965 |
11.940 |
11.888 |
11.841 |
11.743 |
| Difference |
0.007 |
0.008 |
0.007 |
0.004 |
0.005 |
 |
|
Discussion: The measured values were consistent to within 0.001 mags for the check star and 0.002 for the variable star. The Tangra's measurements for the variable star were 0.006 magnitudes away from those done by MaximDL and a possible explanation is that the star very close to the edge of the annulus or the one close to the edge of the measuring aperture may have been accounted for slightly differently in the background calculation. Tangra's measurements of the check star were 0.001 magnitude away from those done by MaximDL and this is bellow the error. Tangra also uses sub-pixel measurements in aperture photometry for those pixels that are partially inside the aperture.
Overall the magnitudes derived by Tangra were a very close match to those derived by MaximDL. One thing that could have contributed to the differences is the fact that Tangra applies dark, bias and flat frames in floating point numbers but it rounds the resulting pixels values to integer numbers before summing them up for the measurements. MaximDL to our understanding does the measurements using the floating point numbers.
References
[1] Stetson. P., 1986, "DAPHOT: A computer program for crowded-field stellar photometry",
http://adsabs.harvard.edu/cgi-bin/bib_query?bibcode=1987PASP...99..191S&db_key=AST
Hristo Pavlov, 21 January 2015
Updated on 28 April 2015
Many thanks to Margaret Streamer for providing science and calibration CCD images of her own observations of variable stars. Those images were used to validate Tangra's Dark and Flat frame processing.