Spectral Sensitivity of WAT902H, WAT120N+ and PC164C-EX2
Abstract
This article studies the spectral sensitivity of popular low light video cameras used for astronomy and determines rough transformations for converting instrumental magnitudes to photometric R and V magnitudes for unfiltered and filtered observations.Introduction
In a paper published for the AAVSO Journal (2000, Henden [2]) writes: "Different CCDs have different response curves. You cannot blindly assume that a CCD has an R-like response as has been quoted in some publications. If the CCD does not behave like a wide-V or a wide-R, then there will be systematic shifts in derived magnitudes depending on the color of the observed object, and these shifts may make combination of results from different observatories difficult. You can remove some of the systematics if you (a) use the closest filter to your CCD response, and (b) transform the results onto the standard system if you know the basic color of the program object and its comparison stars."Video cameras are expected to be no different than CCD cameras and as shown previously for WAT120N+ (2009, Video Photometry [1]) there is a noticeable difference between the response of the camera without a filter, with a red filter and with an infrared block filter. In the photometric systems it is generally possible to convert the magnitudes from one system to another if the star colours are known and for the majority of the standard photometric systems and instrumental magnitudes the transformations are linear. This article repeats the spectral sensitivity test from [1] and tries to identify whether there is a good linear fit between instrumental magnitudes and photometric R magnitudes. In order to determine the actual transformation coefficients a more complicated observations and data reduction would be necessary (such as the one described by 2006, Gary [4]) and this is left for a separate experiment.
Method
A number of videos of a 20x15 acrmin field were recorded inside and around the open star cluster - NGC 6716 in Sagittarius. This area was chosen because it contains stars with a large variety of different colours from very blue to very red. For data reduction the same technique was used as in the (2009, Video Photometry [1]) study. For each of the star fields the deviation of the instrumental magnitude from standard R and V magnitudes versus the star colour was computed and plotted. Tangra can now work with the UCAC3 catalog directly and this catalog was used for star identification and as a source of the B and R magnitudes. The star colour was expressed as B - R because this was the most convenient colour index for the experiment.V magnitudes were computed from the CMC14 star catalog using the Sloan r' magnitude and the J - K colour index from 2MASS.
Equipment, Observations and Data Reduction
The videos were obtained with an 8" Meade LX90 with a F/3.3 focal reducer and recorded on a DVR using MPEG4 compressed video. For more information about the used setup see [1]. Two star fields around NGC 6716 were recorded with each of the three video cameras (WAT120N+, WAT902H Ultimate and PC164C-EX2) using gamma = 1. Each of the two star fields were recorded three times with each video camera - (1) unfiltered, (2) with an infrared block filter and (3) with a combination of a yellow (Wratten #8) and an infrared block filter. The results are presented below where the X axis is the B - R colour index of the star and the Y axis is the deviation of the instrumental magnitude from the R magnitude in UCAC3. To determine the deviation from R for each of the star fields a random reference star was picked (ensuring it is not too faint) and then for each of the stars in the field (R - R0) - 2.5 * LOG10( I / I0 ) was computed, where R0 and I0 are the R magnitude and the measured intensity of the selected reference star and R and I are the R magnitude and measured intensity of each of the stars. Because of the random choice of a reference star the zero point in the Y axis will be different from one video to another and will be unknown. This however is not an obstacle in determining the slope of the line. Also (R - R0) - 2.5 * LOG10( I / I0 ) actually gives Inst - R instead of R - Inst. Instead of correcting all the computations the derived colour coefficients are corrected instead.Between 100 and 200 measurements were made in each of the videos for each of the stars and the average value was taken as the measured intensity. The standard deviation was computed as both intensity and stellar magnitude and is included in the data sheets.
While in the vast majority of the cases only non saturated stars were used there are some single occasions where stars that showed saturated pixels in a small number of the measurements have been used. A star was considered saturated if at least one of its pixels had a value higher than 250.
WAT902H Ultimate
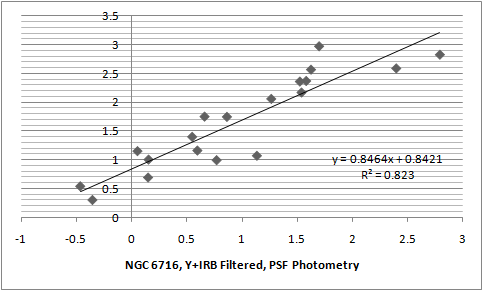
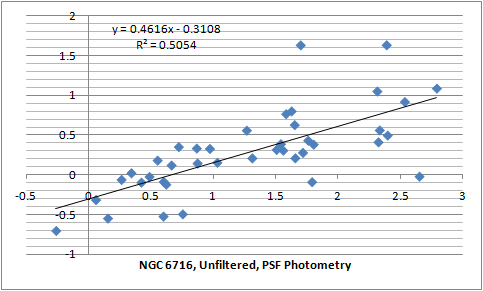
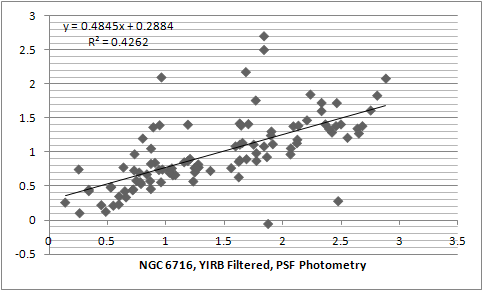
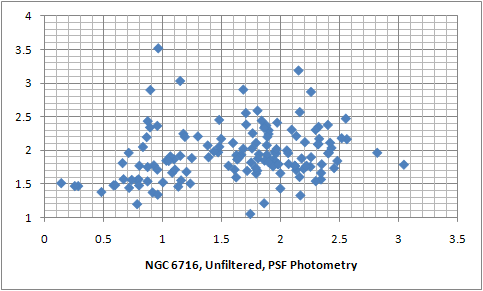
The plots below show the results for the WAT902H Ultimate camera and the complete dataset can be downloaded here. From the last experiment ([1]) it was evident that the observations done with infrared block filter showed the best structure and this was also confirmed to be the case for WAT902H with infrared block filter (the first plot with red data points below). In order to get a single fit from the two separate star fields the dataset from the first star field has been shifted to vertically align with the dataset from the second star field. This was necessary because of the unknown zero point caused by the random choice of a reference star in each of the fields. The plots for the individual star fields are also available here.A good linear fit is evident even without doing flat field and atmospheric extinction corrections, a rough estimate for the errors of which is given later in the article. The second plot (in dark gray) is for the combination of a Yellow and Infrared Block filter and again shows a good linear fit. The last plot (in blue) is for the unfiltered video and it shows a higher deviation but still fitting of a line seems reasonable.
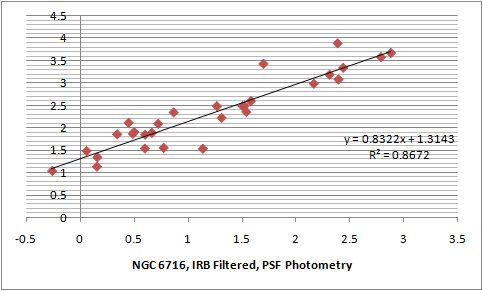
NOTE: Once again because the Y axis shows Inst - R instead of R - Inst, the inclination of the line tells us that the instrumental magnitude is between V and R, rather than between R and I.
WAT120N+
The plots for WAT120N+ are shown next and the raw datasets can be downloaded here. Again the infrared block and the combination of yellow plus infrared block data show a reasonable linear fit. It is interesting that a finer structure is visible but its cause is unclear. The unfiltered plot however doesn't show a good linear fit and all data points look scattered around.Comparing the results for infrared block and unfiltered observations with the results from the previous experiment ([1]) we can conclude that the new results agree with the old results. This is, the infrared block data show a structure and a reasonable linear fit, while the unfiltered data show a scatter, where 90% of the stars are in a 1 magnitude region.
PC164C-EX2
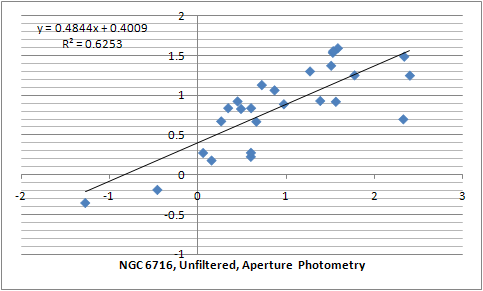
Finally the results for PC164C-EX2 are presented below. The used camera has a measured gamma of 1.0, which may be different from some other PC164C-EX2 cameras that may have a gamma of 0.45. Because of the larger and irregular looking stars, aperture photometry was used rather than PSF photometry. The data for PC164C-EX2 are included in the same file as the WAT902H and can be downloaded here.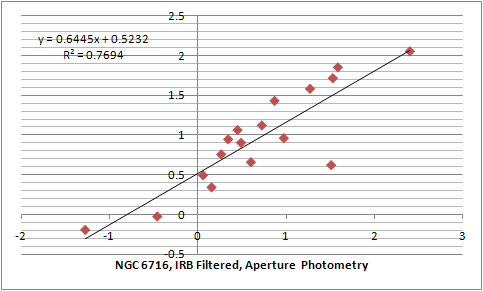
We can do a comparison of the slope observed for WAT902H with the M67 Unfiltered Photometry Experiment (2000, Henden [3]) which states that for Sony CCD cameras the conversion between instrumental magnitude and R magnitude is:
R - Instr = ZeroLevel - 0.6256 * (V - I)
The range of (V-I) colour indexes for spectral types from B0.0 to M4.0 are from -0.31 to 2.43 (2002, Reid [4]). For the same range of spectral types the range for B-R = (B-V) + (V-R) is from -0.49 to 2.64. This range matches the interval of observed stars in this NGC 6716 experiment which indicates that stars from the full range of spectral classes have been observed. Now if we convert the V-I coefficient from [3] to B-R we will get 0.6256 * B_Minus_R_Range / V_Minus_I_Range = 0.4402. This is indeed very close to the linear coefficient of 0.46 for WAT902H determined above (note that we use the opposite sign because we fitted Inst-R instead of R-Inst). From [3] for SONY CCDs for the full range of V-I = 2.74 magnitudes we get that the maximum difference between instrumental and standard R magnitude will be 0.6256 * 2.74 = 1.71 stellar magnitudes. This agrees with the observed deviation in the experiments presented in this article (the full range of values on the Y axis).
"Instr - V" Magnitude Plots
2009 JBAA, Dymock [7] compare CMC14 magnitudes with LONEOS and works out a transformation that allows V magnitudes to be derived from the CMC14 r' Sloan magnitude and the colour index J-K from 2MASS. The transformation is:V = 0.628*(2MASS_J − 2MASS_K) + 0.995*CMC14_r'
This allows the instrumental magnitudes of the three tested video cameras to be compared to V. In order to do this 99% of the UCAC3 stars were cross references with CMC14 using VizieR. This was done by searching in a radius of 2" around the J2000 coordinates of the UCAC3 stars identified during the reduction. Then using the transformation from 2009 JBAA, Dymock [7] a V magnitude was derived for each of the measured stars. Then following the reduction method used for the Inst - R plots, the deviation from V was plotted against the colour index B - R. The results are shown in purple where the Y axis shows Inst - V = (V - V0) - 2.5 * LOG10(I / I0).
The plots for WAT902H and PC164C-EX2 show good linear fits which have smaller residuals when compared to the fit for Instr - R. The maximum deviation of the instrumental magnitude from V is only 0.5 magnitudes for PC164C-EX2 and 0.8 magnitudes for WAT902H. This means that the measured instrumental magnitude light drops will be closer to the light drops in V than in R. Also the data for WAT120N+ didn't show a good linear fit for neither of Inst - R and Inst - V.
.png)
.png)
.png)
| WAT902H | WAT120N+ | PC164C-EX2 |
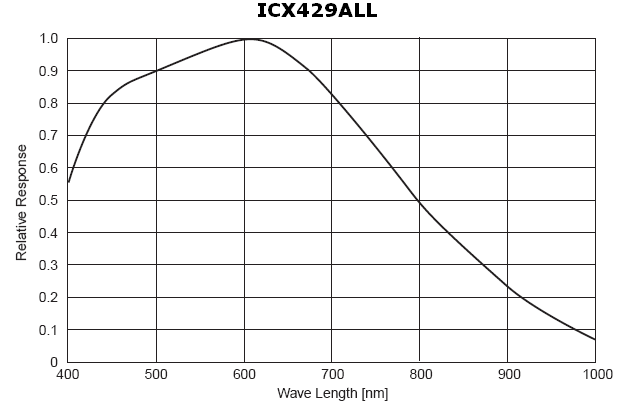
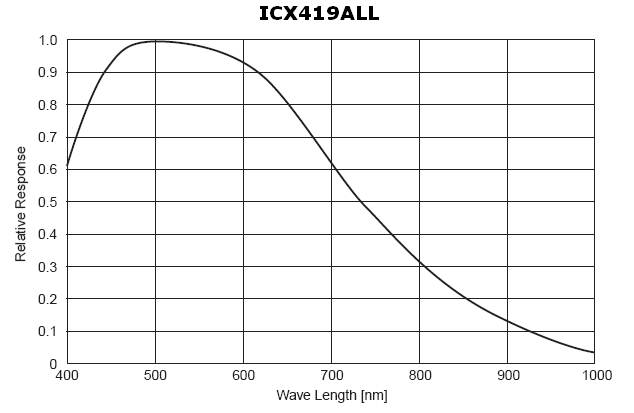
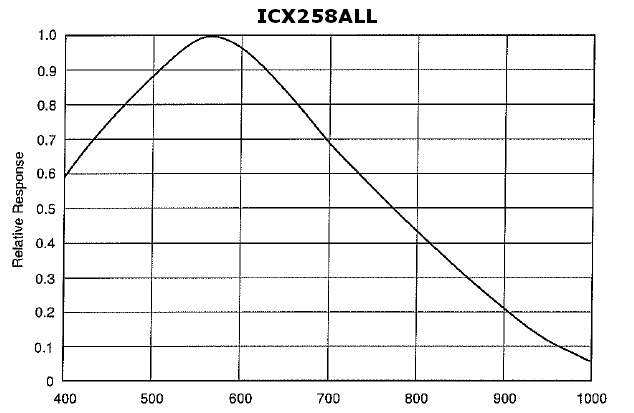
The quantum efficiency of the CCD sensors used in the three video cameras is shown below. Watec have confirmed in a private communication that WAT902H Ultimate uses the ICX429ALL sensor and that WAT120N+ uses the ICX419ALL sensor. The sensor used for PC162C-EX2 hasn't been confirmed and the graph below is for the sensor used in the previous version PC164C-EX.
All plots, including the two individual fields in NGC 6716 used to derive the single linear fit for each of the observations, are available for WAT902H and WAT120N+.
Error Estimates
At the time of the observation NGC 6716 was 22 - 25 degrees above the local horizon. Considering the size of the field of view the atmospheric extinction would cause a difference of about 0.03 - 0.04 stellar magnitudes (for 15 arc min) between the upper and the lower edge of the alt-azimuth field of view.On the same night another experiment was done to determine the effects of different pixel sensitivity (from pixel to pixel) for the WAT120N+ video camera. The same field was recorded 7 times when the CCD was rotated in 7 different angles (between 0 and 360). Then 23 stars that appear in each of the 7 videos (at a different position on the CCD) were identified and measured. The mean value for each of the stars was calculated along with the maximum residual and the standard deviation. The raw dataset is available for downloaded here and the results are presented below.
Each of the bars represents the number of stars that showed a maximum residual / a standard deviation within the given interval. The maximum observed maximum residual was 0.25 stellar magnitudes. Maximum residuals of 0.20 - 0.25 magnitudes were observed for 5% of the stars while 70% of the stars had a maximum residual of 0.15 stellar magnitudes or less.
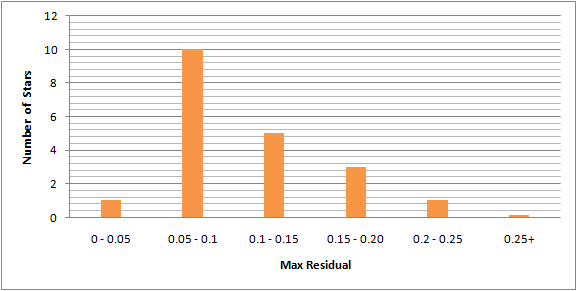
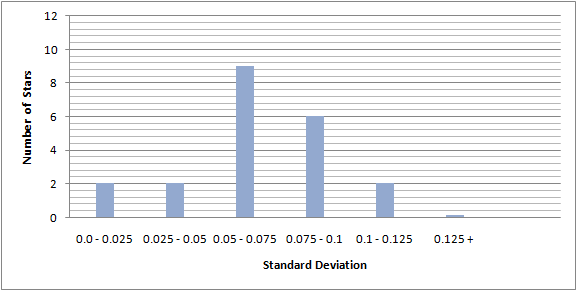
From the numbers above we can expect about 5% of the stars to show instrumental magnitudes which are 0.30m (or more) away from their real value and 70% to have an error of 0.2m or less.
Conclusion
Different video cameras use CCD chips with different quantum efficiency which will result in different spectral sensitivity. As a result stars will appear brighter or dimmer compared to their R and V magnitude depending on their colour. This may result in predicted magnitude drops for asteroidal occultations in V and R to significantly differ from the observed instrumental magnitude drops.The three tested cameras showed a reasonable linear fit with infrared block and infrared block plus yellow filter while the unfiltered measurements showed larger residuals from a linear fit. The best linear fit for unfiltered data was observed for Inst - V for PC164C-EX2 and the WAT120N+ showed scattered data points for both Inst - V and Inst - R. While there is no confirmation and explanation for the larger residuals for WAT120N+ the magnitudes in some catalogs such as UCAC2 are known to show larger systematic residuals as shown below (see Greaves, Red Magnitudes [6]) which indicates that a good transformation may not be always possible.
Additional tests are required for unfiltered WAT120N+ images with a larger number of different telescopes and recording equipment to see whether the scattered data points will be repeated.
The following transformations were determined for WAT902H Ultimate and PC164C-EX2:
     WAT902H Ultimate:
     --------------------------------
        R - Inst = -0.46 (B - R) + Z0
        V - Inst = +0.26 (B - R) + Z0

     PC164C-EX2:
     --------------------------------
        R - Inst = -0.48 (B - R) + Z0
        V - Inst = +0.17 (B - R) + Z0
Where Z0 is an undetermined zero point and (B - R) is the colour index from UCAC3/Supercosmos.Additional experiment that includes correction for flat fields and atmospheric extinction should be able to derive the coefficients for conversion of instrumental magnitudes to R and V magnitudes for WAT902H Ultimate and PC164C-EX2 with a higher precision and certainly. Also those transformations can be obtained versus the 2MASS J - K colour index instead of the UCAC3 B - R. Because most major catalogs include a cross reference with 2MASS using the 2MASS J - K colour index will be a better choice.
Hristo Pavlov, 24 November 2009
References
[1] 2009, "Video Photometry", http://www.hristopavlov.net/Articles/VideoPhotometry.html[2] 2000 JAAVSO, Henden, "The M67 Unfiltered Photometry Experiment", http://adsabs.harvard.edu/abs/2000JAVSO..29...35H
[3] 2006, Gary, CCD Transformation Equations http://reductionism.net.seanic.net/CCD_TE/cte.html
[4] 2002, Reid, Intrinsic colours as a function of spectral type http://www-int.stsci.edu/~inr/intrins.html
[5] 2008, Yoshida, Magnitude System and Color Conversion Formulas http://www.aerith.net/astro/color_conversion/JG/redmags.pdf
[6] Greaves, Red Magnitudes http://www.aerith.net/astro/color_conversion/JG/redmags.pdf
[7] 2009 JBAA, Dymock, Miles, A method for determining the V magnitude of asteroids from CCD images http://www.britastro.org/asteroids/JBAA%20119%20149-156%20Dymock1.pdf