Video Photometry with Tangra - Algorithms and Acuracy
Abstract
This article discusses methods of stellar photometry used by a new software for reducing light curves from videos recorded with low-light video cameras, which is called Tangra . The results from the algorithms are tested to determine the accuracy of the measurements. This article also discusses the effects of gamma correction, spectral sensitivity, anti-blooming and other factors that can affect measurement acuracy.Table of Contents
- Introduction
- Gamma correction in video
- Photometric algorithms in Tangra
- Camera spectral sensitivity and star colour
- Digital filters and anti-blooming
- References
Introduction
Low-light video cameras are nowadays widely used by non professional astronomers for timing events such as asteroid occultations, lunar occultations, lunar grazes and mutual events of the satellites of Jupiter, Saturn and Uranus. They are also used for observing double stars during total lunar occultations to determine the position angle and the brightness of the individual components. Video cameras have been also successfully used in video astrometry of both fast and slow moving asteroids and comets. The astrometry derived from timing of asteroid occultations done by non professional astronomers has a very high and well established accuracy. However the accuracy of the photometric measurements derived from video observations hasn't been studied comprehensively before.Video cameras use CCD chips similar to the ones used in the normal CCD cameras however there are some important differences. While in standard CCD cameras each pixel has (usually) a 16-bit value which is a number between 0 and 65535, the low-light video cameras use an 8-bit number that has only 256 different values for each pixel. The much lower number of values per pixel means coarse intensity resolution per pixel. When no gamma corrections are involved the difference of one unit of pixel intensity in a video camera corresponds to 256 units in a real CCD camera. This is good for reducing the size of the real-time video stream but will lead to a decreased photometric resolution. Most video cameras, including low-light video cameras used for astronomy, record videos that are intended to be watched on a monitor (CRT, LCD etc). Because of this the video cameras usually apply an encoding gamma correction of 0.45 which makes the recorded light intensity non linear. If uncorrected this will give magnitude differences derived from pixel intensity that differ from the actual magnitude differences. Furthermore anti-blooming gates are used in video cameras to prevent saturation. This also makes the camera response non linear.
Tangra is a new software which is currently under development. It can reduce light curves from video observations and its main goal is to improve object tracking and accuracy of noisy videos recorded with mobile telescopes where factors like alignment errors and wind can make measurements of light curves difficult. Tangra uses a classical aperture photometry but it also offers new approaches including PSF photometry and digital filters. This article discusses in details the photometric algorithms used in Tangra and attempts to evaluate their accuracy.
Method
I recorded a number of videos of a 20x15 acrmin field in two open star clusters - M7 in Scorpio and M23 in Sagittarius when for my latitude they were more than 40 deg above the horizon. I then measured the intensities and/or derived magnitudes of a number of stars and compared them with the values from a star catalog. I mostly used the magnitudes from UCAC2 but also did a comparison with the magnitudes from UCAC3. I used a WAT-120N+, PC164C-EX2 and WAT-902H Ultimate video cameras.Equipment and Observations
To record the video data I used a 20cm (8") Meade LX90 Schmidt-Cassegrain with a Meade F/3.3 focal reducer.
 Some of the observations I did without a filter while others I did with a RED filter or a combination of a RED + IR Block filter to
get the spectral sensitivity very close to the UCAC2 R band. I did this in attempt to decrease the error from star color when comparing the reduced magnitude differences to the R magnitude differences from the UCAC2 star catalog.
Some of the observations I did without a filter while others I did with a RED filter or a combination of a RED + IR Block filter to
get the spectral sensitivity very close to the UCAC2 R band. I did this in attempt to decrease the error from star color when comparing the reduced magnitude differences to the R magnitude differences from the UCAC2 star catalog.
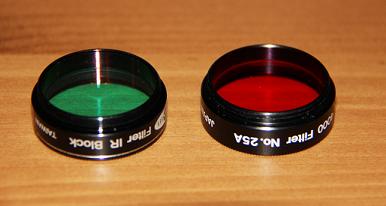
As a red filter I used a Wratten #25A filter which cuts all the light below 590nm. I used an original Meade 25A filter made in Japan. I also had another cheaper 25 filter made in China which was noticeably darker than the Meade filter and I decided not to use it. To cut the infrared part of the spectrum I used a cheap infrared block filter. The spectral sensitivity of the CCD chips used by the various low-light video cameras are generally different but most of them have the highest sensitivity somewhere between V and R, while still have reasonable sensitivity in the near infrared light. The spectral sensitivity depends entirely on the CCD chip that is used in the video cameras. For example PC164C EX uses a SONY ICX258ALL chip which is most sensitive at 580nm, while the WAT-120N+ uses a SONY ICX419ALL which is most sensitive at 500nm. I used this as a reference and assumed that PC164C-EX2 uses the same chip. While this may not be correct it is not essential for the results in this article. The CCD chip model used in WAT-120N+ was confirmed in a personal correspondence with Watec.
The diagram below shows the relative response in percents of the CCD chips used in PC164-EX2 and WAT-120N+ video cameras. The zone in red corresponds to the highest transmittance region of the standard photometric R band and is roughly the zone limited by the #25A and IR Block filters. The #25A has zero transmittance below 590nm ([8]) and the IR Block filter has a zero transmittance above ~700nm.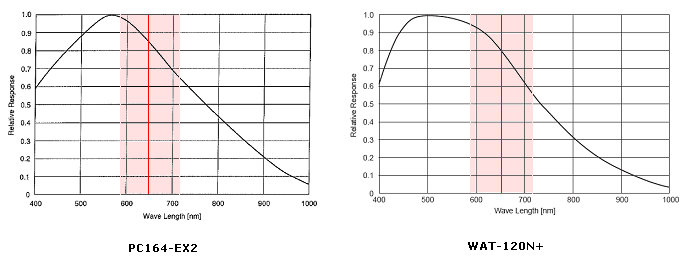
Both the #25A and IR-Block filters have almost constant transmittance in the regions where they don't block light. This means that the relative spectral sensitivity of the filters and the CCD matrix together will be roughly the CCD spectral sensitivity in the region 590nm - 710nm. This is slightly different than the UCAC2 magnitude band but I hope it could be a good approximation for the purpose and the accuracy of the tests described in this article.
From the description of the UCAC2 catalog (Zacharias+, 2004, [7]) we find that: The UCAC bandpass (579-642nm) is between V and R. Observations were often made under non-photometric conditions and UCmag is provided here for identification purposes only. Estimated errors are 0.3 magnitude absolute, 0.1 magnitude relative.
The videos were recorded on a Digital Video Recorder (DVR) recording directly to a 2.5" hard drive using an MPEG4 compression which adds a little bit of extra noise. The DVR is part of my usual setup which I have used to successfully record a number of asteroid occultations and mutual events since 2007. The video signal was also timestamped by my KIWI OSD unit, which is also part of the same setup. The areas around the timestamps were excluded from processing during the measurements so pixels from the timestamp itself do not affect the measurements. Considering the errors of the UCAC2 magnitudes, the approximate spectral band used and the noise added by the MPEG4 compression we could expect the best random error from the tests to not be better than 0.1 - 0.2 mag when comparing the relative magnitudes of the stars.
 I measured the positional accuracy of Tangra by finding astrometric positions of asteroids based on analysis of video. The results reported to MPC show an accuracy of < 0.3" in 60% of the reports and < 1.0" in 100% of the reports. I used the astrometric capabilities of Tangra to automatically recognize the stars from M7
that were in the UCAC2 star catalog. About 10% of the stars (very rough estimate) were not in UCAC2. I then ran photometric measurements for between 150 and 200 video frames and took their average to derive a single value for each of the measured stars.
I measured the positional accuracy of Tangra by finding astrometric positions of asteroids based on analysis of video. The results reported to MPC show an accuracy of < 0.3" in 60% of the reports and < 1.0" in 100% of the reports. I used the astrometric capabilities of Tangra to automatically recognize the stars from M7
that were in the UCAC2 star catalog. About 10% of the stars (very rough estimate) were not in UCAC2. I then ran photometric measurements for between 150 and 200 video frames and took their average to derive a single value for each of the measured stars.
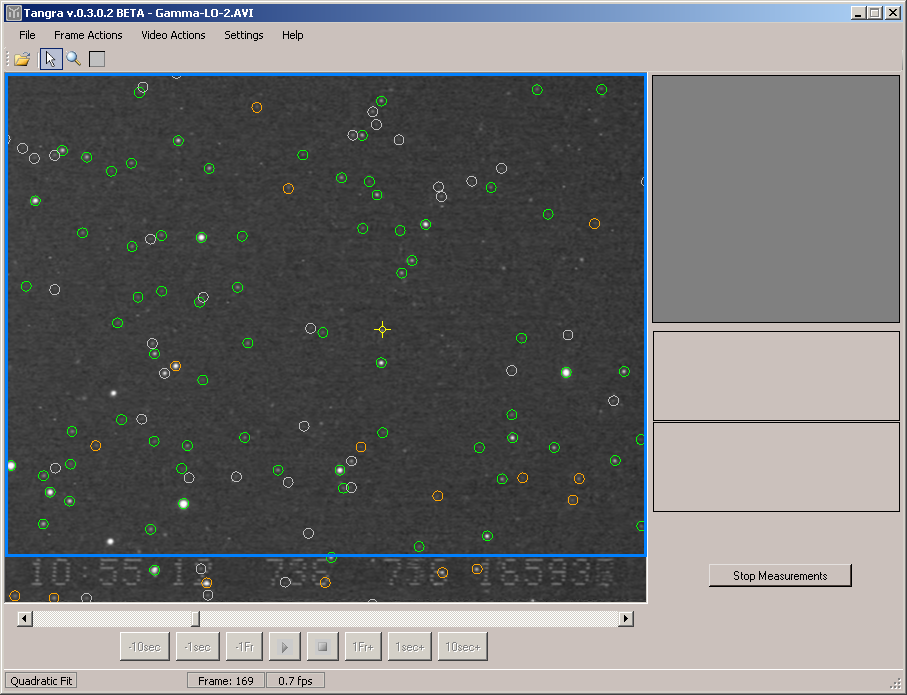
In every frame I only use stars that are not too close to the borders of the video frame and are not too close to the OSD timestamp of the video. The blue frame (on the left) shows the limiting area. A star is measured and used in the tests only if its center is more than 5 pixels inside the blue frame. With a FWHM of around 3 pixels this will guarantee that more than 97% of the star light will be fully inside the video and will not be close to the timestamp OSD.
The stars displayed in green are matched stars with residuals less than 1" and the orange stars are matched stars with astrometric residual higher than 1" but no more than 4 pixels away from the expected star position. The gray circles are undetected stars or stars fainter than 13.8 mag. For most tests I used stars in the regions of 8.5 mag to 13.8 mag
For the measurements I use green and orange stars that don't have saturated pixels, where saturation is defined as 250. If a star has one or more pixels with a value of 250 or higher it will be considered as saturated and will not be included in the tests. There were a couple of exceptions where I included stars that showed saturated pixels in a very small number of the frames. I explicitely mention this when I use such stars.
A large fraction of the measurement process was fully automated because I could not check every single measured frame I needed a way to reject wrong star detections, variable stars or simply stars with too large differences of their star magnitude from the catalog value. The test and rejection were done in two steps. In the first step I check the fitted Gaussian point spread function for each of the recognized stars, and compute the average FWHM from all PSF fits. I then reject all 'stars' for which the FWHM residual is more than 3 standard deviations from the computed average value. By doing this I reject hot pixels that could have been mistaken for a star and reject close elongated doubles that may have been recognized as a single star. After that I do an aperture photometry for all non rejected stars and using a linear least squares I do the following fit for all the data:
(1) Mag(R, UCAC2) = A - 2.5 * B * Log10 (Intensity)
Where Mag(R, UCAC2) is the red magnitude from UCAC2, Intensity is the measured signal-minus-noise intensity from the aperture photometry and A and B are the linear coefficients. The coefficient B is needed to deal with non linear response due to gamma corrections and other effects. Equation (1) is only an approximation and is used to find and reject 'bad' stars. This is done by excluding all stars with residuals bigger than 1 magnitude. After each iteration a new linear least square fit is computed for the remaining stars and the operation is repeated again until no star has a residual bigger than 1 magnitude. The remaining stars are considered as 'good' and a photometric algorithm is used to measure the intensity of those stars in the given frame. After measuring 150 to 250 frames the average values are computed and used as the final raw data for the further tests. It is generally possible that not all stars will be recognized in every frame for example because of faint stars or higher astrometric residuals. At the end a final eye check is done to exclude other suspicious measurements based on the number of detections and the intensity 1-sgma error.
Before having a look into the photometric algorithms used I'd like to discuss the gamma effects in a video recording and attempt to measure those effects.
NEXT >>
Some of the observations I did without a filter while others I did with a RED filter or a combination of a RED + IR Block filter to
get the spectral sensitivity very close to the UCAC2 R band. I did this in attempt to decrease the error from star color when comparing the reduced magnitude differences to the R magnitude differences from the UCAC2 star catalog.As a red filter I used a Wratten #25A filter which cuts all the light below 590nm. I used an original Meade 25A filter made in Japan. I also had another cheaper 25 filter made in China which was noticeably darker than the Meade filter and I decided not to use it. To cut the infrared part of the spectrum I used a cheap infrared block filter. The spectral sensitivity of the CCD chips used by the various low-light video cameras are generally different but most of them have the highest sensitivity somewhere between V and R, while still have reasonable sensitivity in the near infrared light. The spectral sensitivity depends entirely on the CCD chip that is used in the video cameras. For example PC164C EX uses a SONY ICX258ALL chip which is most sensitive at 580nm, while the WAT-120N+ uses a SONY ICX419ALL which is most sensitive at 500nm. I used this as a reference and assumed that PC164C-EX2 uses the same chip. While this may not be correct it is not essential for the results in this article. The CCD chip model used in WAT-120N+ was confirmed in a personal correspondence with Watec.
The diagram below shows the relative response in percents of the CCD chips used in PC164-EX2 and WAT-120N+ video cameras. The zone in red corresponds to the highest transmittance region of the standard photometric R band and is roughly the zone limited by the #25A and IR Block filters. The #25A has zero transmittance below 590nm ([8]) and the IR Block filter has a zero transmittance above ~700nm.
Both the #25A and IR-Block filters have almost constant transmittance in the regions where they don't block light. This means that the relative spectral sensitivity of the filters and the CCD matrix together will be roughly the CCD spectral sensitivity in the region 590nm - 710nm. This is slightly different than the UCAC2 magnitude band but I hope it could be a good approximation for the purpose and the accuracy of the tests described in this article.
From the description of the UCAC2 catalog (Zacharias+, 2004, [7]) we find that: The UCAC bandpass (579-642nm) is between V and R. Observations were often made under non-photometric conditions and UCmag is provided here for identification purposes only. Estimated errors are 0.3 magnitude absolute, 0.1 magnitude relative.
The videos were recorded on a Digital Video Recorder (DVR) recording directly to a 2.5" hard drive using an MPEG4 compression which adds a little bit of extra noise. The DVR is part of my usual setup which I have used to successfully record a number of asteroid occultations and mutual events since 2007. The video signal was also timestamped by my KIWI OSD unit, which is also part of the same setup. The areas around the timestamps were excluded from processing during the measurements so pixels from the timestamp itself do not affect the measurements. Considering the errors of the UCAC2 magnitudes, the approximate spectral band used and the noise added by the MPEG4 compression we could expect the best random error from the tests to not be better than 0.1 - 0.2 mag when comparing the relative magnitudes of the stars.
Software and Data Reduction
The software reduction was done with a new software for video photometry (still under development) called Tangra. The version that I currently have can also do astrometric measurements. Tangra can align a star field rotated in any angle, match the stars from a catalog and do a precise astrometric fit. I measured the positional accuracy of Tangra by finding astrometric positions of asteroids based on analysis of video. The results reported to MPC show an accuracy of < 0.3" in 60% of the reports and < 1.0" in 100% of the reports. I used the astrometric capabilities of Tangra to automatically recognize the stars from M7
that were in the UCAC2 star catalog. About 10% of the stars (very rough estimate) were not in UCAC2. I then ran photometric measurements for between 150 and 200 video frames and took their average to derive a single value for each of the measured stars.
I measured the positional accuracy of Tangra by finding astrometric positions of asteroids based on analysis of video. The results reported to MPC show an accuracy of < 0.3" in 60% of the reports and < 1.0" in 100% of the reports. I used the astrometric capabilities of Tangra to automatically recognize the stars from M7
that were in the UCAC2 star catalog. About 10% of the stars (very rough estimate) were not in UCAC2. I then ran photometric measurements for between 150 and 200 video frames and took their average to derive a single value for each of the measured stars.In every frame I only use stars that are not too close to the borders of the video frame and are not too close to the OSD timestamp of the video. The blue frame (on the left) shows the limiting area. A star is measured and used in the tests only if its center is more than 5 pixels inside the blue frame. With a FWHM of around 3 pixels this will guarantee that more than 97% of the star light will be fully inside the video and will not be close to the timestamp OSD.
The stars displayed in green are matched stars with residuals less than 1" and the orange stars are matched stars with astrometric residual higher than 1" but no more than 4 pixels away from the expected star position. The gray circles are undetected stars or stars fainter than 13.8 mag. For most tests I used stars in the regions of 8.5 mag to 13.8 mag
For the measurements I use green and orange stars that don't have saturated pixels, where saturation is defined as 250. If a star has one or more pixels with a value of 250 or higher it will be considered as saturated and will not be included in the tests. There were a couple of exceptions where I included stars that showed saturated pixels in a very small number of the frames. I explicitely mention this when I use such stars.
A large fraction of the measurement process was fully automated because I could not check every single measured frame I needed a way to reject wrong star detections, variable stars or simply stars with too large differences of their star magnitude from the catalog value. The test and rejection were done in two steps. In the first step I check the fitted Gaussian point spread function for each of the recognized stars, and compute the average FWHM from all PSF fits. I then reject all 'stars' for which the FWHM residual is more than 3 standard deviations from the computed average value. By doing this I reject hot pixels that could have been mistaken for a star and reject close elongated doubles that may have been recognized as a single star. After that I do an aperture photometry for all non rejected stars and using a linear least squares I do the following fit for all the data:
(1) Mag(R, UCAC2) = A - 2.5 * B * Log10 (Intensity)
Where Mag(R, UCAC2) is the red magnitude from UCAC2, Intensity is the measured signal-minus-noise intensity from the aperture photometry and A and B are the linear coefficients. The coefficient B is needed to deal with non linear response due to gamma corrections and other effects. Equation (1) is only an approximation and is used to find and reject 'bad' stars. This is done by excluding all stars with residuals bigger than 1 magnitude. After each iteration a new linear least square fit is computed for the remaining stars and the operation is repeated again until no star has a residual bigger than 1 magnitude. The remaining stars are considered as 'good' and a photometric algorithm is used to measure the intensity of those stars in the given frame. After measuring 150 to 250 frames the average values are computed and used as the final raw data for the further tests. It is generally possible that not all stars will be recognized in every frame for example because of faint stars or higher astrometric residuals. At the end a final eye check is done to exclude other suspicious measurements based on the number of detections and the intensity 1-sgma error.
Before having a look into the photometric algorithms used I'd like to discuss the gamma effects in a video recording and attempt to measure those effects.