Video Photometry with Tangra - Algorithms and Acuracy
Spectral Sensitivity, Colour and Catalog Magnitude Differences
Video cameras used without a filter (and also used with a filter) will have different spectral sensitivity compared to standard magnitude bands such as the R band which is the closest band to the video camera sensitivity but is still different. This will make the measured stellar magnitudes to be different than the magnitudes in the standard photometric band listed in a catalog and could be an explanation of the large random errors that we encountered in the measurements so far. The different spectral sensitivity also means that any derived stellar magnitudes from measured intensities will be in the photometric system of the video camera and will generally differ from the standard photometric bands. Next I will attempt to measure the differences in derived stellar magnitudes in the system of the video camera compared to the standard photometric R band.For this test I recorded a number of videos of M23 with gamma = OFF and with different combinations of filters. I had video without a filter, with a red filter only, with an infrared block filter only and with both red and infrared block filters. I then measured about 100 stars in the range of 10.8 to 12.8 UCAC2 magnitudes and manually identified about 78 stars that were detected as non saturated stars in all of the four videos. I then wrote a small software tool that queried VizieR and identified 98% of those stars in the UCAC3 catalogs and I got the B and R2 magnitudes from UCAC3. Next I picked one of the faintest stars that was detected in all four videos and picked it as a zero reference point. I then computed magnitude differences of each of the remaining stars with this zero level star (which is 2UCAC 24656589 or 3UC 143-271475). For the video measurements I computed the differences as -2.5 * LOG10 (I0 / I). I also computed the corresponding magnitude differences in the R2 band of the UCAC3 as M0 - M. Then for each of the four videos I derived a Delta Mag which was the difference between the UCAC3 R2 magnitude difference and the magnitude difference from the measurements. Delta Mag(M, I) = M0(3U) - M(3U) + 2.5 LOG10 (I0 / I), where M0 is the 3U R2 magnitude of the reference star, M(3U) is the 3U R2 magnitude of the star, I0 is the measured intensity of the reference star and I is the measured intensity of the star. Intensities were measured using aperture photometry.
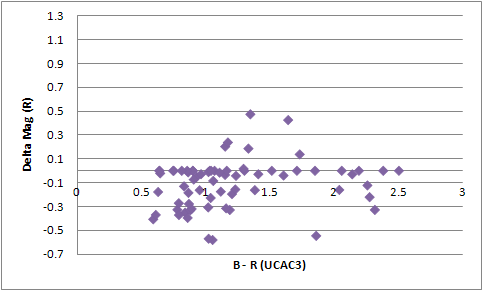
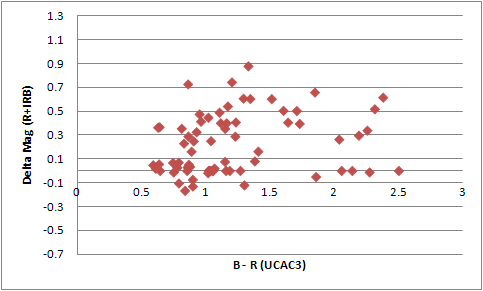
I then plotted for each of the four videos x = B - R, to y = Delta Mag(R, I), where B is the B magnitude from UCAC3 and R is the R2 magnitude from UCAC3. The plots with those values show the deviation of the WAT120 photometric system from the standard photometric R band as a function of the effective wave length of the stars, which is represented by the colour index B - R. The raw data can be downloaded here.
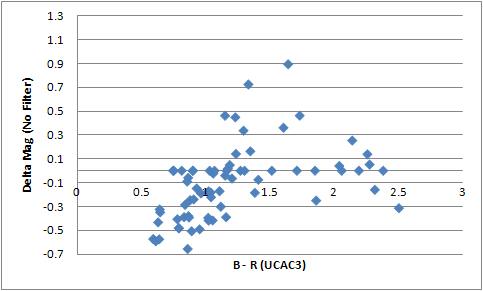
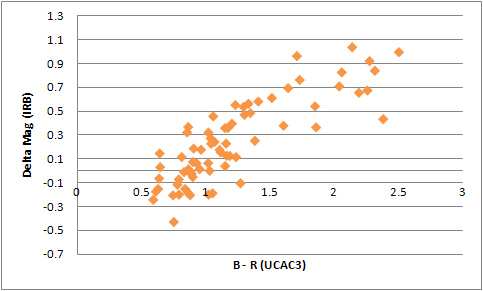
The results immediately show a large difference in the majority of the cases which explains the large random error of all the previous measurements. It is interesting that the video recorded with infrared block filter only gives a nice polynomial fit with an approximate error of 0.2 magnitudes for about 90% of the stars. The video recorded with no filter shows that about 25%-30% of the stars gives the same magnitudes as the R band magnitudes however the remaining 70%-75% of the stars have an easy deviation of 0.5 magnitudes and could even go to more than 0.7 magnitudes. Because the plot shows the deviation of the individual stars this means that the errors from spectral sensitivity from magnitude differences between those stars can easily be 1.0 magnitudes and above. This agrees very well with the observed random error in the previous tests.
The video recorded with a red filter only seems to give the largest number of magnitudes exactly the same as the R band magnitudes but this is still for only about 50% of the stars and the remaining 50% show deviations of 0.3 - 0.5 stellar magnitudes. And finally the combination of red and infrared block filter is actually not the best spectral fit at all. As the no filter video about 25% of the stars show exact R band magnitudes and the other 75% show a deviation of up to 0.7 magnitudes and above.
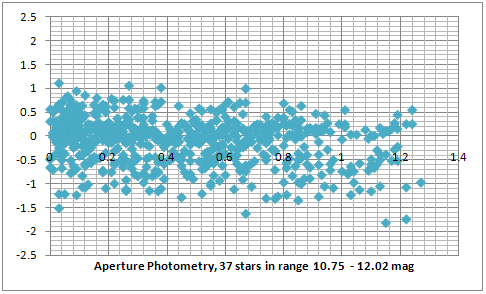
And as a comparison the light blue plot below is from one of the previous measurements of a video of M7 recorded with a Red filter only and only includes stars in the middle range i.e. the bright and faint end of stars have been excluded. The plot shows the magnitude deviation from the true R band magnitude difference of all pairs of 37 stars. We can see that a good number of the pairs show a very small deviation (as a good number of the stars in the R plot above show magnitudes exactly as R). We also see that the majority of the star pairs show a deviation in the range of 1.0 magnitudes. This agrees with the observed differences from the R band studied above (see the purple plot above). So we can conclude that the 'random' error of the measurements that can be up to 1.0 magnitudes from the R band magnitude can be fully explained by the spectral sensitivity of the video camera and the different effective wave length of the stars.
These results demonstrate that quantative photometric measurements with video cameras are valid in the photometric system of the video camera only and show a serious deviation from the standard photometric R band. The infrared filter showed the best distribution and it would be generally possible to convert magnitudes from the photometric system of the video camera to the standard R band provided that the colour indexes of the compared stars are known and a good calibration has been done. However when deriving stellar magnitudes of new double stars their spectral class and colour index is unknown so if no filter is used the derived magnitude can differ easily by 1.0 magnitudes and more from the real magnitude in the photometric R band. In case of double star discoveries a red filter, such as the Wratten #25A filter that I used, will give results with an error of +/- 0.3 magnitudes (from the real R band magnitude) for 80% of the stars.
Also the (gu)estimate that the red + infrared block filter will give very close magnitudes to R was incorrect by more than 0.5 magnitudes.
However a second test is needed to confirm the results of the current test. The second test will need to have a larger number of data points and needs to take into account the different sensitivity from pixel to pixel.