| Occult Watcher 3.2 |
| EVENTS | CONFIGURATION | EVENT DETAILS | OBSERVATION PLANNER | C2A ADD-IN | MORE ADD-INS | TROUBLESHOOTING | DOWNLOAD |
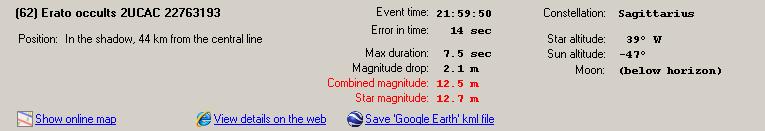
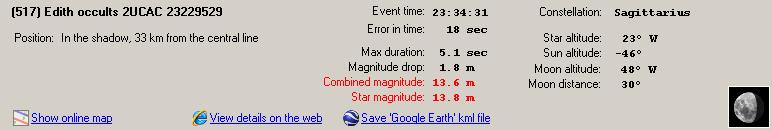
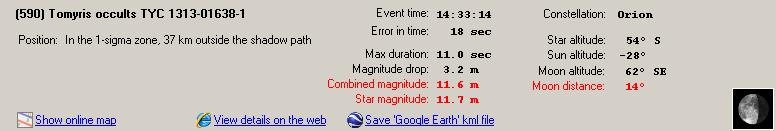
When the user selects an event from the main list, the details of this event are shown below the event list along with the path graph. The details contain general information about the event and may or may not show the moon phase depending on whether the moon is above the horizon at the time of the occultation. On the details panel there could be up to four links: to display an online map using GoogleMaps, to open up the path as KML file in Google Earth (displayed only if GE is installed), to navigate to the prediction web page for this event and to display the station sorts (displayed only if you have configured an Occultation Planning account).
The moon is shown as seen from your site considering is it in the northern/southern or hemisphere.
When the events are listed chronologically it is possible that one event is included in more than one feeds. In this case when you click on "View details on the web" Occult Watcher will show you a menu so you can select the details from which feed you want to see. Also in this case there will be a "Feeds" label on the right and if you hover over it, it will show which feeds contain this event.
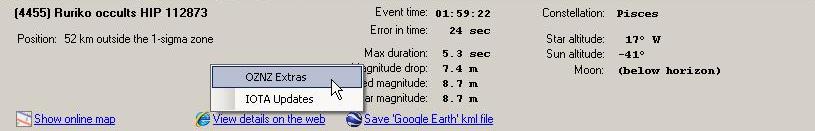
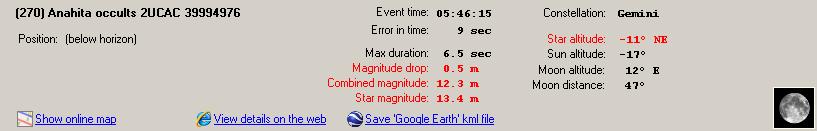
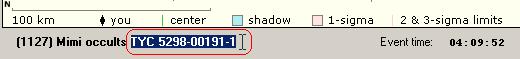
Also if the value of one of the important event parameters is below/above the specified threshold, it will be displayed in red to warn the user.
The thresholds can be configured from Configuration -> Other options -> Advanced -> Warning Thresholds.
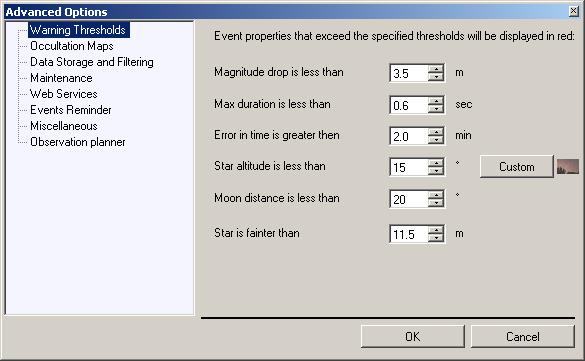
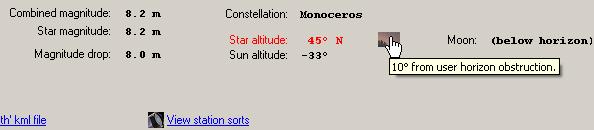
Since version 3.2 users can define their custom horizon which OccultWatcher will take into account. To do this click on the "Custom" button next to the Star Altitude Threshold and then follow the instructions to edit the UserHorizon.txt file. Once you have a user horizon defined, if the star is closer to the user horizon than the configured star altitude threshold, OccultWatcher will show the star altitude in red and a small icon next to the altitude value will indicate the star is too close to the user horizon. If you hover your mouse over the icon OccultWatcher will display the distance from the star to the obsticle defined in the user horizon. If the star is closer than 2 degrees then the value will be shown in orange. If the star is behind the user horizon the altitude will be shown in yellow on a black background.
Back on you detail panel you can select with the mouse the asteroid or star name and then copy and paste it in your planetarium program or occultation report form.
The path graph is drawn above the details panel and shows the predicted path of the shadow with the 1, 2 and 3-sigma zones. Positive chord offsets are to the right and negative to the left. Also the feed name is displayed on the path. The tiny gray marks are put on every 100 km fundamental plane distance or every 100 chord offsets.

In some cases for low probability events the shadow may be very small compared to the sigma zones and will like like a very thin line

If you have registered an account then any already announced sites will be shown as small gray bars in the upper part of the path.

If you hover your mouse over any of them you will see a tooltip showing details about the observer that has announced this site.

Weather forcast information will be available for events that are happening within the next 72 hours. At the moment OccultWatcher uses 7Timer! as a weather service provider. The weather info will be coded as a different color of the displayed sites. Additionally when hovering the mouse over the site an information about the weather forecast for the particular site will be displayed:

The following colors are used to encode the cloud cover:

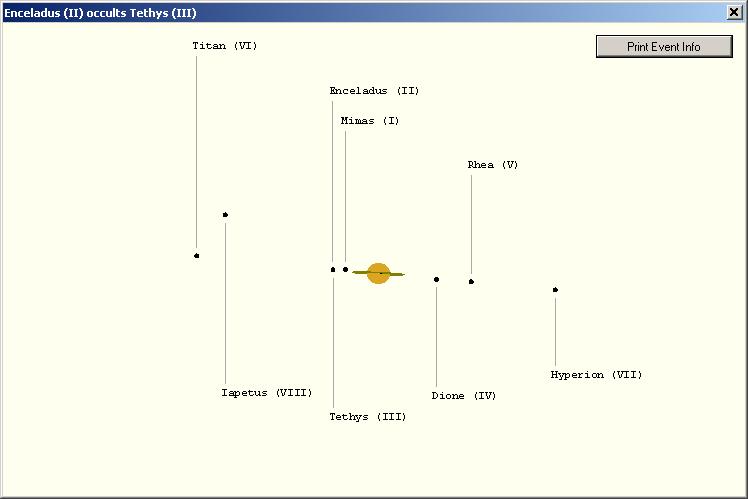
The details for the mutual satellite events look quite differently compared to the asteroidal occultation details. The graphic of the event is shown as ploted in Occult.

Because those events are pretty much seen exactly the same way from anywhere on Earth, then a GoogleMap is not needed to show the prediction path. Instead a "picture" of the configuration of the satelites is shown. There is also a print button that will print all the important information about the event on one A4/letter sheet.
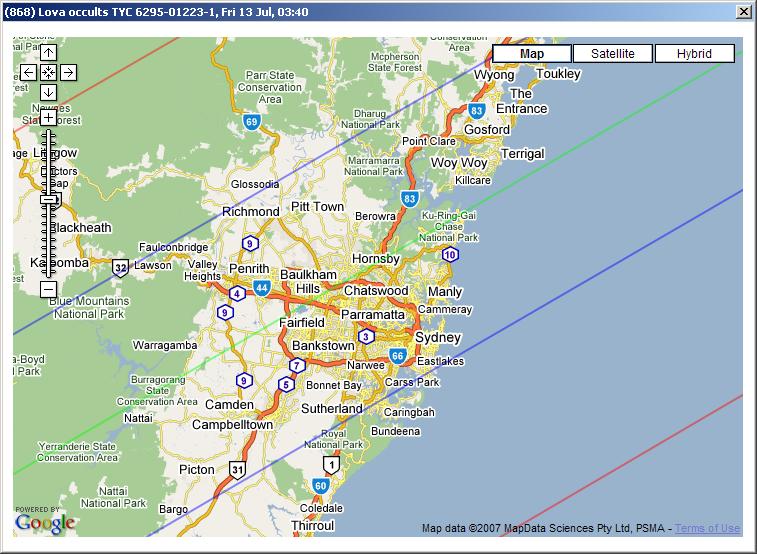
For all asteroidal events there is a GoogleMap that showing the shadow path and you need to be online to use it. The GoogleMap is shown in its own frame and the user can use all the satellite/hybrid/zoom options.
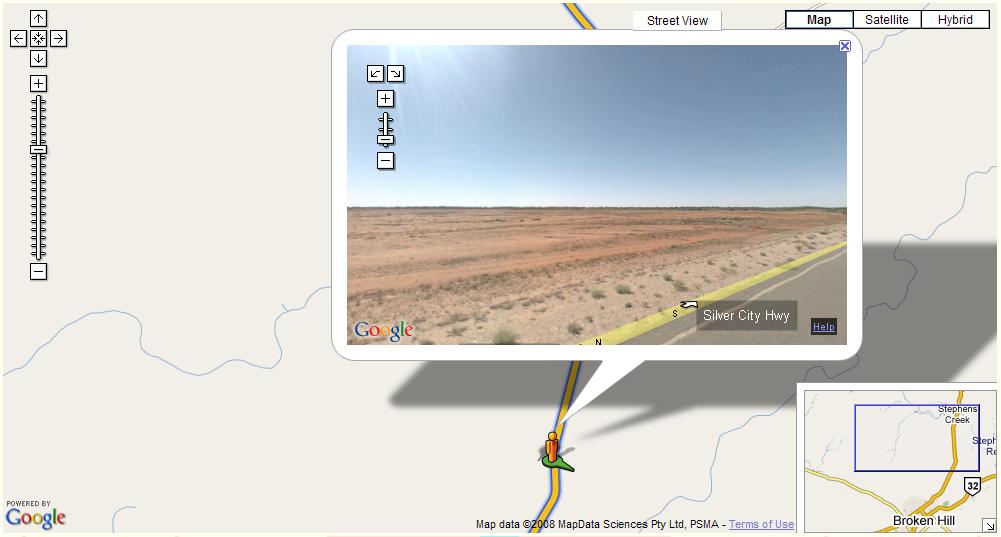
If the "Street View" has been enabled (it is enabled by default) and if you live in an area for which Google provides street view data, you can also enter in Street View by left clicking on the map or using the "Street View" button at the top.
Distances
OccultWatcher displays different types of distances from the home site or an announced station to the predicted shadow. It is important to understand the differences between those distances and know how they are used.Travel Distance
From the mobile observer's point of view probably the most important distance is the TravelDistance. This is the distance on the Earth's surface that the observer needs to travel to see the predicted event. Usually this is the distance to the centerline but could also be the distance to a location where the star is above the horizon. In the second case an observation will be nearly impossible (when the star altitude = 0) but including these events is a good indication of how close to the observer some events of possible interest may be. The TravelDistance is only displayed in the main events list in OccultWatcher and on the GoogleMap when choosing a station but most importantly the TravelDistance is used when filtering the events close to the observer. For example if the user has specified a filter of "no more than 100km outside the 1-sigma zone" this will be interpretted by OccultWatcher in the following way:1) I'm happy to give it a go to anything for which I will observe from with the 1 sigma zone.
2) I'm happy to travel up to 100 km away from home to do this.
So OccultWatcher will show events for which:
- The observer's location is within the 1-sigma zone
- The observer's location is no more than 100 km away from a 1-sigma zone. This is 100 km in any direction, not necessarily perpendicular to the center line.
Because of the second point OccultWatcher will also include events for which the star is below the horizon at the observer's location, but for which there is a 1-sigma zone that is less than 100km away and from which the star is visible on a zero horizon. Such events are marked with a special icon - a blue car, meaning you *must* travel to see the event.
The travel distance will also show the direction in which the observer will need to travel to get closer to the predicted shadow. For example "25 km NW" or "25 km @320"
Fundamental Plane Distance
Some times for the main belt asteroids and most of the time for Centaurs and Trans-Neptune objects the predicted shadow will not fall on the Earth and the prediction error may be big enough for the whole Earth to fit inside the 1-sigma zone for example. In 1980s most of the main belt asteroid occultation predictions were having similar error compared to the size of their shadow but still there were observers that were catching them. So a big error should not put off the observer from attempting those events. In fact they are scientifically one of the most interesting ones because the orbits of those bodies are not well known and if you are successful to detect an occultation, your observation will lead in a huge improvement of the orbit. Furthermore noone has observed an occultation from a TNO (yet) and you may want to be the first one to have done that!For this sort of events where the predicted shadow doesn't fall on the Earth OccultWatcher cannot use the "TravelDistance" in its previous meaning for the filtering unless the observer owns a spaceship with a space telescope fitted in its space-trailer and is willing to travel :) For filtering those events OccultWatcher uses the distance in space also known as sky plane distance or fundamental plane distance. By definition this is the linear distance between the projections of the asteroid shadow and the projection of the observer's location on a plane perpendicular to the direction from the Earth to the star. OccultWatcher may show fundamental plane distances in a several places and they will be suffixed with (fp) to indicate that they are fundamental plane ditances.
Chord Offset
The two distances mentioned so far are good for filtering and mobile trip planning purposes but they are not good for chord coverage planning. One of the main functions of OccultWatcher was desgined to be to help observers to coordinate better their stations so there are less chances for duplicated chords and there is a better covarage of the whole predicted path. A chord is a line on the asteroid in the directon of it's movement and it directly correlates to a duration of observed occultation. Each positive observation determines exactly one chord of the asteroid shape. To get the asteroid shape many different chords are needed. And to do that from a planning point of view you should aim to setup your stations in a way so they are not too close to the stations of the other observers.Depending on the size and the shape of the Asteroid as well as on how well we know its orbit there may be different approaches of how to setup the stations to achive best results but in general in all cases we don't want to duplicate a chord or to be very close to another observer. The number that correlated directly to a distance on the asteroid projection is the newly introduced Chord Offset.
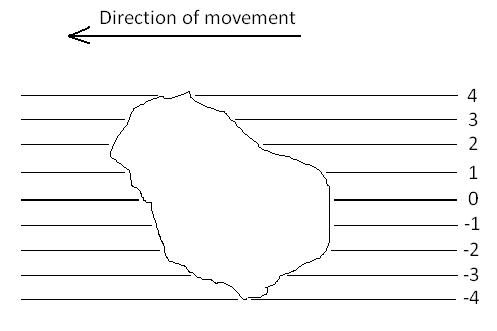
The chord offset is the rounded to a whole kilometer distance from the center line on the asteroid. The distance is possitive to the right and negative to the left when facing the direction of the movement. One of the good things about the chord offset is that it is directly related to a life size distance on the asteroid. This should be the distance of a choice when coordinating multiple observations of an occultation.
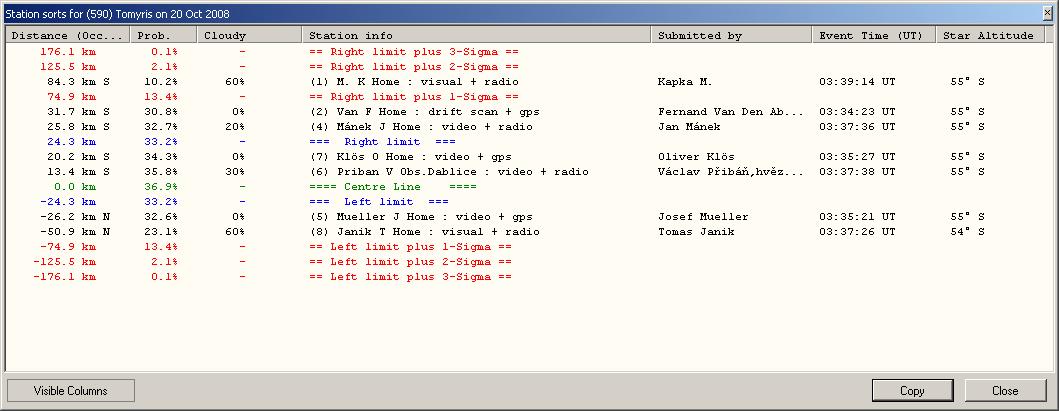
Occult Station Sort Distance
For compatibility with the station sorts produced by Occult, OccultWatcher also displays another distance that can successfully be used to coordinate chords. This distance is only displayed in the Station Sorts form in OccultWatcher and it matches exactly the distances comming out from Occult stations lists. The Occult distance is also shown with its direction. For example 102.4 km NE means that the center line is 102.4 km NE from the observer. Note that this is different from the TravelDistance that indicates the direction to the center line. So if the Occult distance is 102.4 km NE then the Travel Distance will be ~100km SW as you need to travel SW to get to the center line but you are NE of the center line.Left or Right from the Center Line
In some cases it will be impossible to know where a station really is by only giving the distance (without a sign) and a direction such as East, West, North or South. For example for the event below an observer from New Caledonia (where the big red cross in the middle is) the shadow is in all directions: W, N and S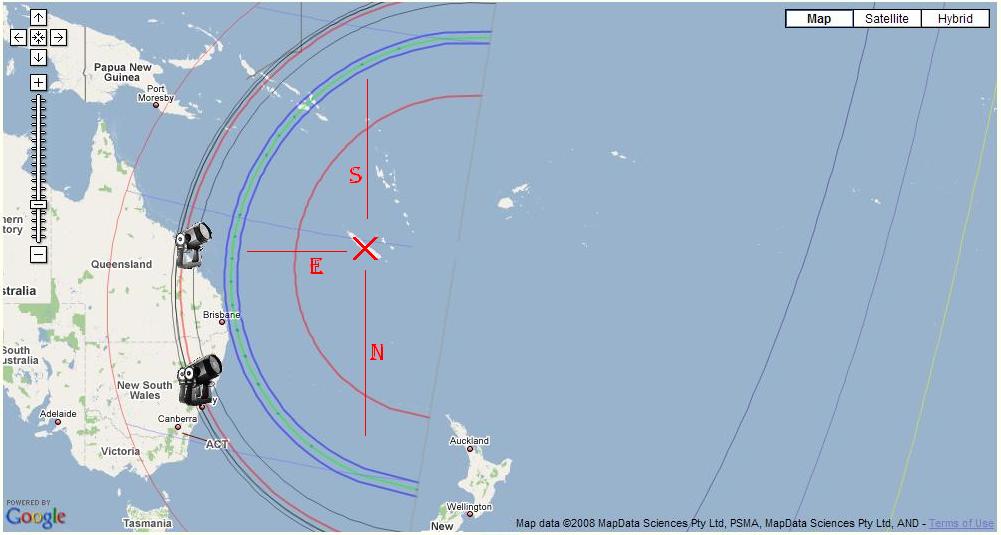
To be unambigious OccultWatcher (and Occult) are using a rule that all distances that are right from the center line when facing the direction of the shadow movement will have a + sign and all directions left of the center line will have a negaive (-) sign. OccultWatcher shows a signed distance on a couple of places and also shows "left" or "right" indication as well:
On the path plot on the main form and on the GoogleMaps form, stations that are left from the center are ploted to the left and those that are right from the center line are ploted to the right. There is also an "L" and "R" sign.

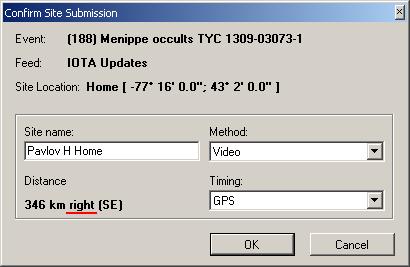
When announcing a station the distance is shown unsigned and there is a "left" or "right" suffix appended to it to indicate whether the site is left or right from the center line.

On the station sorts form the Occult distance is displayed with a sign to indicate whether it is left or right from the center line and also has a dirrection letter appended (such as E, W, S, NW, etc). Additionally all the shadow limits and sigma limits are indicated to be a LEFT or RIGHT limit.